New Product Development Outlook for beverages
Natural the top attribute for new beverage launches


The NFL playoffs are in full swing, but for a majority of football fans, they are left waiting for next year. From now until the draft takes place at the end of April in Philadelphia, super fans will be keeping a watchful eye on mock draft predictions. Although these football analysts invest a lot of time and research into these mock drafts, prognosticating the outcomes for 32 different teams is no easy feat.
In the beverage market, predicting what trends will emerge, which will fizzle out or which ones will gain momentum can be a valuable tool as companies invest in their research and development (R&D) operations. In Beverage Industry’s New Product Development Outlook 2016 Study, respondents indicated which trends they think will be the most popular in 2017.
According to survey-takers, the product attribute with highest consumer need/interest is “natural.” With 72 percent of respondents listing natural as a “latest trend,” the product attribute moved up from its No. 2 position in last year’s survey. This year, “organic,” which was No. 1 in last year’s survey, dropped to No. 3, as only 58 percent of respondents indicated it as a latest trend. “Healthy” captured the No. 2 spot with 60 percent of respondents naming the product attribute. This was an improvement from last year, when healthy was in the No. 4 spot.
Another product attribute that saw its latest trend status improve was “energy boosting,” which was No. 4 in this year’s survey with 37 percent naming it a latest trend. Last year, energy boosting was No. 6. Another product attribute that ascended was “convenience,” as 33 percent of survey-takers named it a latest trend, bringing it up to No. 5 in comparison to its No. 9 position last year.
The Top 10 list also saw some other product attributes make the list this year with “probiotic/prebiotic,” “vitamin, mineral fortified” and “high protein” finding a home on the list.
However, some product attributes saw their latest trend status decline. Despite the 2015-2020 Dietary Guidelines for Americans including an added sugars recommendation and the U.S. Food and Drug Administration announcing that an Added Sugars line will be incorporated in the new Nutrition Facts labels, which will take effect in mid-2018, “low sugar” dropped in this year’s survey. With only 26 percent of survey-takers listing this as a latest trend, the product attribute earned the No. 9 position versus being in the No. 3 position last year.
“Low calorie” also declined, but only slightly, dropping from No. 5 last year to the No. 6 spot this year.
Jolt of flavors
Home accents that feature references to coffee, like “I only need coffee on days that end with a ‘y’” or “Coffee, because adulting is hard,” can garner a chuckle from consumers, but are not far removed from what beverage-makers are seeing when it comes to their top flavors.
In this year’s survey, 24 percent of respondents listed coffee as a top-selling flavor for 2016, followed by chocolate (22 percent), cherry (20 percent) and mango (20 percent). In comparison to 2015, the Top 3 flavors all were fruits with raspberry (20 percent), cherry (16 percent) and orange (16 percent) filling those spots. Coffee and chocolate also were low on the list last year with both only having 9 percent of respondents list them as a top-selling flavor in 2015.
Despite non-fruit flavors capturing the Top 2 spots, the top-selling flavors of 2016 still saw many fruit flavors in the mix. Apple, coconut, peach and raspberry all had 18 percent of respondents indicate them as a top seller. Rounding out the Top 10 were passion fruit and vanilla, with each being listed as a top-selling flavor by 16 percent of survey-takers.
However, citrus flavors fell out of favor with respondents as none cracked the Top 10. Lemon (14 percent), grapefruit (12 percent) and lime (12 percent) each outperformed orange, which was the No. 3 top-selling flavor listed in 2015. This year, only 10 percent of survey-takers listed the citrus flavor as a top seller.
Orange also saw a decline in usage during 2016. Among utilized fruit flavors, 35 percent listed orange this year compared with 47 percent last year. Lemon also took a tumble in this year’s survey when it came to utilization. Last year’s No. 1 flavor used with 56 percent naming it, lemon fell to No. 3 with 48 percent noting its utilization in this year’s survey. Lime was down slightly with 40 percent listing it as a flavor used in 2016 versus 42 percent in 2015.
Although citrus flavor usage might have recessed in 2016, the usage of fruit flavors overall saw a slight increase, according to respondents. The mean amount of fruit flavors used by a survey-taker in 2016 was 8.2 compared with 8 in 2015.
With 84 percent of respondents indicating that they use fruit flavors in new product development, the top performers were mango (52 percent), coconut (50 percent) and peach (50 percent). Although mango’s usage declined 4 percentage points, it still outperformed the rest of fruit flavors in utilization. Coconut and peach, however, saw their usage increase in comparison to the previous year. Coconut moved up 10 percentage points, while peach increased 8 percentage points.
When it comes to usage, other fruit flavors that performed well in this year’s survey were apple (44 percent), cherry (42 percent) and pineapple (42 percent).
The fruit flavors that were used the least in 2016 were papaya (17 percent), guava (15 percent) and dragon fruit (13 percent). However, it should be noted that even though they were in the bottom three, papaya and dragon fruit each saw their utilization increase compared with 2015. Papaya increased 10 percentage points, while dragon fruit increased 6 percentage points.
Dissecting fruit flavors at a more granular level, more than three-quarters of respondents indicated that they use berry flavors in their new product development, which is similar to 2015 numbers. Of those using berry flavors, the average amount used is 3.8 berry flavors, up slightly from last year’s 3.3 berry flavors.
The most-utilized berry flavors used in new product development for 2016 were blueberry (66 percent), raspberry (55 percent), strawberry (55 percent), blackberry (50 percent) and cranberry (50 percent). Although these same berries encompassed last year’s Top 5, the order and usage did change. For instance, raspberry’s usage declined 19 percentage points, yet it only fell one spot, from No. 1 in 2015 to No. 2 in 2016. Blueberry, however, saw its usage increase 24 percentage points in comparison to last year’s survey, moving it up from No. 4 to No. 1.
Yet, fruits and berries were not the only flavors R&D specialists turned to in 2016. Non-fruit flavors were used by 81 percent of respondents with the mean usage at 4.2 flavors. Usage was up slightly from last year’s survey with three-quarters of respondents using non-fruit flavors, but the mean remained the same. Vanilla (59 percent), chocolate (50 percent), coffee (50 percent), green tea (43 percent) and cinnamon (41 percent) were the most utilized.
Perhaps in line with coffee’s ascension to No. 1 as a top-selling flavor for 2016, the java flavor saw its usage increase 8 percentage points, moving it from No. 5 last year to being tied for No. 2 this year. Vanilla also saw its usage increase for 2016 as 59 percent indicated using it in new product development versus the 50 percent last year. Chocolate dropped from No. 1 to No. 2 this year, but its usage from respondents remained flat.
Green tea saw its usage increase compared with last year as it moved up 4 percentage points. However, mint declined 15 percentage points, dropping it to No. 8 vs. No. 4 last year.
Going into 2017, respondents continue to see a positive future for coffee as it tied with cherry, coconut, ginger, orange, strawberry and vanilla — all at 18 percent — as an anticipated top-selling flavor.
For coffee, this is vast improvement compared with 2015 when only 6 percent listed as an anticipated top seller. However, no anticipated top-selling flavors even cracked 20 percent. In last year’s survey, raspberry was listed by 30 percent of respondents followed by lemon and pomegranate, each with 20 percent, as anticipated top-selling flavors.
More ways to imbibe
Once again, new product development within alcohol releases fetched the top spot for the coming year.
Forty-four percent of respondents listed wine/beer/spirits as categories most likely to be a part of their new product development plans. However, this was a decrease from last year in which 56 percent named this area.
Tied for No. 2 were coffee/tea and water/juice as each had one-third of respondents list these beverage categories. Sports/energy drinks were not far behind with 32 percent followed by carbonated soft drinks (26 percent) and dairy-based drinks/alternatives (25 percent).
For water/juice, this was a decline compared with last year’s survey (33 percent in 2016 vs. 40 percent in 2015). Yet, the other categories saw new product development plans increase. Coffee/tea increased 16 percentage points, while sports/energy drinks increased 13 percentage points.
But no matter the area of new product development in which beverage manufacturers are planning to participate, consumer demand was the top motivating factor listed by respondents. This is a change from last year’s survey in which increasing sales was the top motivator listed. Increasing sales still ranked high with respondents (No. 2) and was followed by keeping a competitive edge as the key motivators for introducing new beverages.
In order to develop new product ideas, survey-takers name consumer trends (65 percent) as the top idea source. This position is up from last year’s survey in which it was No. 2, but actually is down 3 percentage points. However, customers/customer demand saw its use as an idea decline even more. Although it came in at No. 2 with 56 percent naming it as an idea source, this is 20 percentage points lower than it ranked last year.
Other popular idea generators listed by respondents were in-house through teams and meetings (49 percent), consumer research/testing (44 percent), and marketing and sales (40 percent).
Be natural
As indicated by its position as the No. 1 product attribute, natural continues to have a significant impact on new product development.
In 2017, 87 percent of survey-takers plan to use natural flavors versus the 13 percent that plan to use artificial flavors in their new product development. This is up from last year’s survey in which it was an 83-17 split for natural flavor usage.
Among those using natural flavors, 56 percent indicated that this was an increase of natural flavor usage with consumer demand/preference/request being the most frequent reason listed. This indication of an increase in usage is up 6 percentage points from last year’s survey.
Natural colors also continue to resonate in new product development. According to respondents, 85 percent are planning to use natural colors in 2017 compared with 15 percent that are planning to use artificial colors. Similar to natural flavors, the mean using natural colors in 2017 is up from planned usage in 2016 when 80 percent listed it.
However, when asked whether this was an increase in usage, the numbers were very similar to last year’s survey. Thirty-nine percent indicated this was an increase, while 38 percent said the same thing in 2015.
Once again, consumer demand/preference was the top reason listed for increasing natural color usage.
Shared interests
When it comes to company size, this year’s survey had a mean of 223 employees with a median of 50 employees.
For new product development, nearly three-quarters of respondents indicated that fewer than 10 employees are involved in this process, with a median of five employees contributing to development. This is fairly similar to last year’s survey in which nearly three-quarters had fewer than 10 employees involved in new product development with a median of four employees.
Additionally, it looks like more beverage manufacturers are keeping their new product development processes in-house as only a quarter of respondents indicate outsourcing part of the process. In comparison, about one-third indicated outsourcing as a part of the process in 2015.
Among the areas that beverage-makers are outsourcing product development, prototype development, concept and product testing, and market research were the Top 3 listed. These also were named in 2015, except market research was the top outsourced process listed.
When approaching new product development, 84 percent of survey-takers note that a team approach is utilized, up 2 percentage points from last year’s survey.
Among those who use a team approach, sales/marketing (73 percent) were the top department listed. Upper management (69 percent), production (46 percent), R&D (44 percent) and customers (40 percent) rounded out the Top 5.
This order makeup is identical to last year’s survey; however, all departments had higher percentages, most notable upper management and production, which were 11 and 10 percentage points higher, respectively.
The majority of respondents noted the chief executive officer’s involvement in the new product development among those who indicated upper management as part of the team. For those survey-takers, just under one-third said that the chief executive officer was the leader/decision maker.
In comparison, 100 percent of respondents that listed upper management involvement in 2015 noted the chief executive officer was involved with 41 percent naming the executive the leader/decision maker.
Supplier involvement, however, seems to be on the decline. Only 39 percent of respondents indicate working with a supplier on new product development compared with the 48 percent that listed it last year.
Among those who are working with suppliers during the development process, providing raw materials/ingredients, samples and technical support/expertise were the most common roles utilized by suppliers. These same three were indicated in last year’s survey, albeit at higher percentages.
The stage at which supplier involvement was initiated differed from last year’s survey. This year, the majority (59 percent) of beverage manufacturers that involve suppliers in the development process brought them in at the beginning stage — after inception and through completion — with only 27 percent involving them at inception/idea stage through completion and 14 percent after formulation through completion.
Although the majority initiated involvement at the beginning stage last year, it was 13 percentage points lower as more suppliers were brought in at the inception/idea stage.
Once again, the timeframe in which beverage-makers are developing new products is being completed faster. For new product development — from inception to launch — the average time was seven months compared with eight months in the previous survey.
One-third of respondents indicated this was a faster timeframe than previous years, which is up from the quarter that noted faster development times in the 2015 survey.
Although development timeframes are increasing, it does not mean that beverage manufacturers are making more products. According to respondents, the average number of new products developed in 2016 was about 11. In comparison, an average of 21 new products was developed in 2015.
This decrease in developed new products also transcended to the number of new products released. The average number released in 2016 was eight vs. 12 in 2015.
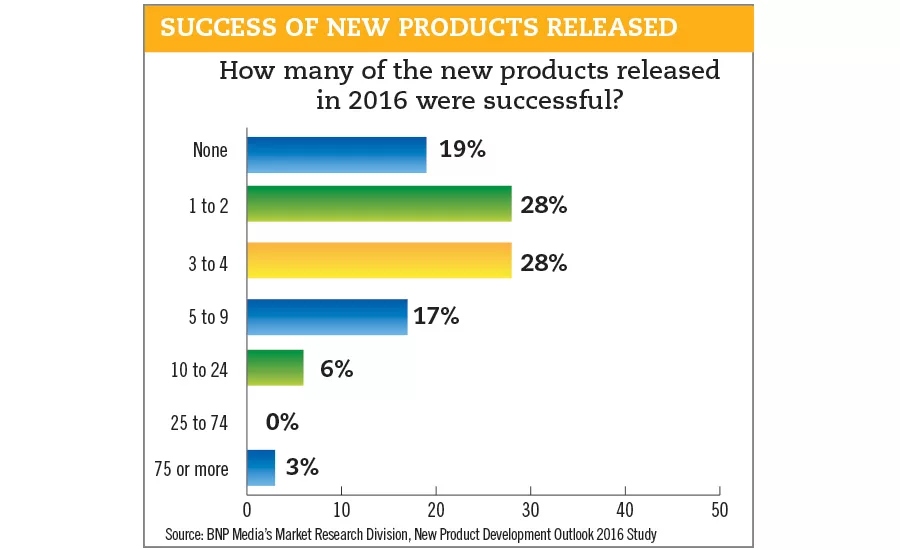
However, the decrease in products developed and released did not continue when it came to the number of successful new products. For 2016, the average number of successful beverage releases was five. In comparison, the average number was two for the 2015 survey.
Because of the fewer developed new products, the average percentage of success was up significantly — 50 percent in 2016 vs. 7 percent in 2015. The same pattern also was found within new products launched, with the average percentage of successful products released at 77 percent vs. 13 percent last year.
Prognosticating 2017
Perhaps the high success rate for 2016 new product development can be found in beverage-makers 2017 plans.
Slightly more than half of respondents are planning to launch more new products this year compared with 2016. Among those noting the increase, the average percentage increase of product launches is 31 percent. Last year, half of respondents indicated plans to launch more new products with an average percentage increase of 57 percent.
Fifty-three percent indicated having a definitive plan for new product development, while more than three-quarters will conduct a post-launch assessment.
Regarding the importance of steps in new product development, launch (85 percent), final product development (84 percent) and production (84 percent) had the highest percentage of respondents list them as highly important.
Consistent with last year’s survey, total cost of new product development showed great variance among respondents. Thirty-eight percent of new products fall within the $1,000-$19,999 range. Yet, the mean cost was $59,181 and the median was $15,000.
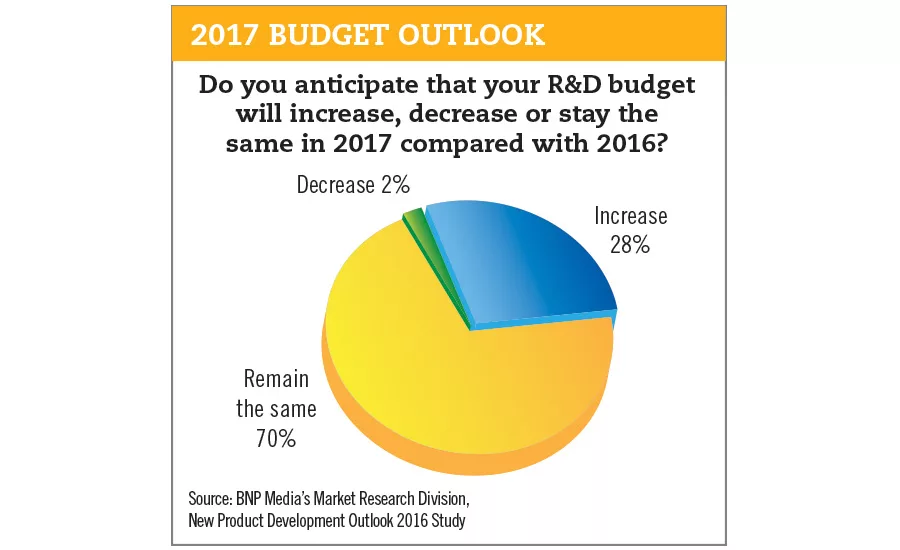
When it came to R&D budgets, 70 percent expect them to remain the same with 28 percent noting an increase. BI
Flavorful Future
Beverage-makers are at no loss of flavors from which to choose when developing new beverages. In Beverage Industry’s New Product Development Outlook 2016 Study, BNP Media’s Market Research Division detailed some of the hottest flavor trends in 2016 as well as what to expect in 2017.
Click here to view the findings.
Beverage Industry’s New Product Development survey was conducted by BNP Media’s Market Research Division. The online survey featured two fieldworks. The first was conducted between Oct. 13 and 26, 2016, and the second was between Nov. 3 and 11, 2016, and included a systematic random sample of the domestic circulation of Beverage Industry.
Of the respondents, 32 percent process beer, 30 percent process coffee and tea, 30 percent process juice and juice-type drinks, 30 percent process water, 28 percent process soft drinks, 26 percent process energy drinks, 21 percent process dairy-based drinks, 18 percent process spirits, 18 percent process sports drinks, and 5 percent process wine.
Fifty-nine percent of respondents were from companies with less than $10 million in annual revenue. Another 11 percent of respondents also were from companies with revenue between $10 million and $50 million. A total of 7 percent were from companies in the mid-size range of $50 million to less than $100 million. Nine percent were from companies with revenue between $100 million to less than $500 million. In the $500 million to less than $1 billion range were 9 percent of respondents. Representing the large-size range of more than $1 billion in company revenue were 7 percent of respondents.
Males accounted for 67 percent of the respondents, and the average age equated to 44. For industry experience, 4 percent had less than one year; 11 percent indicated one to three years; 33 percent reported four to 10 years; 25 percent said 11-20 years; 18 percent listed 21-30 years; 9 percent had 31-40 years of experience; and 2 percent indicated more than 40 years.
Regionally, 30 percent said they currently live in the South, 21 percent indicated the Midwest, 30 percent listed the Northeast and 19 percent reported living in the Western portion of the United States.
Looking for a reprint of this article?
From high-res PDFs to custom plaques, order your copy today!


