2016 New Product Development Outlook for beverages
Organic named top trend for new beverages in new year


This past year, Americans finally got a chance to see whether any the 2015 references in “Back to the Future Part II” would come true. Although the Chicago Cubs attempted to make the World Series prediction a reality, they fell short. However, in business, prognostication is less about fantasizing about the future and more about anticipating how your products and services can benefit, or even shape, the future. In Beverage Industry’s New Product Development Outlook 2015 Study, respondents helped to shed light on what they think will be the latest product attribute trends, flavors and much more in 2016.
According to survey-takers, “organic” will be the latest trend in the new year. With only 10 percent of respondents listing it as a low need/interest, the remaining 90 percent indicated its prevalence. The trend led all other product attribute interests with 38 percent of survey-takers listing it as a latest trend. This is vast change from last year’s study where it came in at No. 8 and only 18 percent listed it as a latest trend.
Maintaining its No. 2 status, “natural” had only 4 percent of respondents list the product attribute interest as a low need/interest while 34 percent named it as a latest trend.
“High protein,” last year’s No. 1 product attribute interest, fell to No. 18 with only 6 percent indicating it as a latest trend. Also falling down
the list was “convenience.” Last year’s No. 4 product attribute interest, which fell to No. 9 in this year’s survey, “convenience” only had 4 percent name it as a low need/interest; however, 66 percent listed convenience as a high need/interest. Only 12 percent named it as a latest trend.
In addition to “high protein,” “vitamin, mineral fortified” (No. 10 last year) and “probiotic/prebiotic” (No. 6 last year) fell out of the Top 10 this year. Replacing these product attribute interests were “country of origin labeling” (No. 6), “ethnic” (No. 8) and “cognitive health” (No. 10).
Buzzing about flavors
When developing new products, many note that taste is king. With flavor playing such a vital role, this attribute can garner a lot of attention.
Different from previous years, this year’s survey asked respondents whether they used berry flavors in 2015, which flavors and how many. The same question framework was asked for non-fruit flavors and fruit flavors. Last year, survey-takers only were asked which flavors they used in their new products.
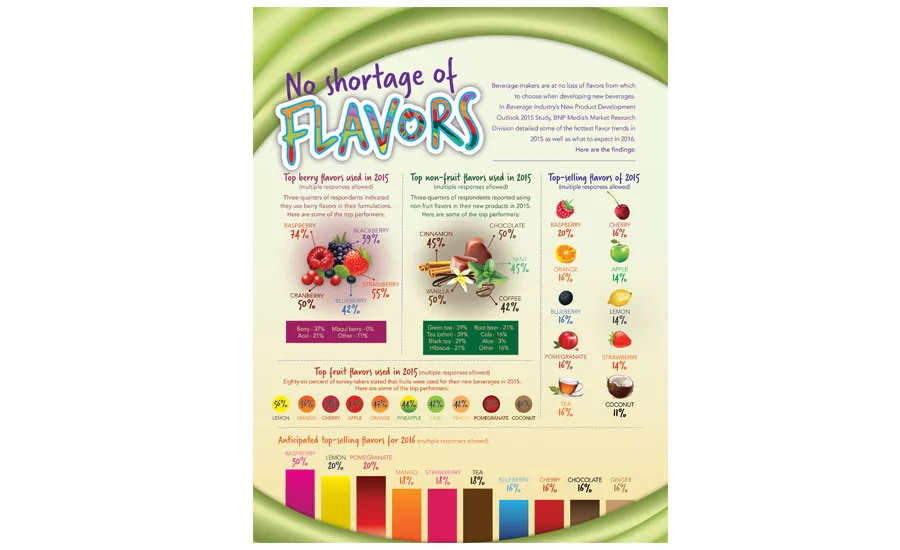
For berry flavors used in 2015, three-quarters of respondents indicated that these flavors were part of their new product releases. On average, 3.3 berry flavors were used by each company. The most popular berry flavor was raspberry with nearly three-quarters of survey-takers listing it. Strawberry came in second with 55 percent naming the berry flavor, and half of respondents used cranberry in their formulations in 2015.
Additional berry flavors listed were blueberry (42 percent), blackberry (39 percent), berry (37 percent) and acai (21 percent). No respondents named maqui berry, while 11 percent selected “other” for berry flavor options.
For non-fruit flavors, three-quarters of survey-takers stated that their companies utilized these flavor options in 2015 with an average of 4.2 non-fruit flavors used by each company.
Fifty percent of responding companies selected chocolate and vanilla as top selections. Cinnamon and mint also were popular non-fruit flavors in 2015 as each was used by 45 percent of survey-takers. Rounding out the Top 5 was coffee with 42 percent.
Tea flavors also were notable choices with green tea (39 percent), tea – other (39 percent) and black tea (29 percent) listed by survey-takers. Also receiving double-digit responses were hibiscus (21 percent), root beer (21 percent) and cola (16 percent). Aloe, the only single-digit response, garnered a 3 percent response. Sixteen percent of respondents selected “other” for their non-fruit flavors used in 2015.
For fruit flavors used in 2015, 86 percent of respondents noted these were part of their formulations. An average of eight fruit flavors were used by each company. With more than half of respondents indicating use, lemon (56 percent), mango (56 percent) and cherry (53 percent) were the top selections. Apple and orange rounded out the Top 5 with each having 57 percent naming the fruit flavor.
Pineapple also was a popular choice in 2015, with 44 percent of survey-takers listing the flavor. Lime, peach and pomegranate each were named by 42 percent of respondents while 40 percent indicated they used coconut in 2015.
Not utilized as frequently in 2015 were dragon fruit (7 percent), papaya (7 percent) and apricot (2 percent).
When it comes to the top sellers in 2015, it looks as though fruit and berry flavors were the most popular in 2015. According to respondents, 20 percent indicated that raspberry was a top-selling flavor in 2015 followed by cherry and orange, each with 16 percent. Apple and blueberry rounded out the Top 5 with 14 percent each.
In comparison to last year’s survey, chocolate was the No. 1 top-seller for 2014 with 29 percent followed by vanilla (24 percent), mango (22 percent), green tea (13 percent) and raspberry (13 percent). This year, chocolate just cracked the Top 20 with 9 percent of respondents naming it a top-seller in 2015. This was a six-way tie with black tea, coffee, ginger, lime and root beer, which each were named by 9 percent of survey-takers.
Green tea took the biggest fall as only 7 percent of respondents named it as a top-seller in 2015.
On the upward trend was cherry. The No. 2 top-selling flavor used in 2015, the fruit flavor barely cracked the Top 20 last year. Tea – other flavors also were more successful in 2015 vs. 2014. With 14 percent of respondents naming it a top-seller, tea – other made the Top 10 in 2015. However, only 4 percent of survey-takers listed it as a top-selling flavor in 2014.
Transitioning into the new year, fruit flavors are topping the list of the anticipated top-selling flavors for 2016. Raspberry once again leads all with 30 percent of respondents expecting this will be a top seller next year. Lemon and pomegranate tied for No. 2 with each having 20 percent of survey-takers naming these fruit flavors.
In contrast to last year’s survey, in which the Top 3 anticipated top-selling flavors all were non-fruit flavors: chocolate (29 percent), coffee (22 percent) and vanilla (20 percent). This year, the first non-fruit flavor listed was tea – other, which was in a three-way tie with strawberry and mango for No. 4 as each had 18 percent of survey-takers name them.
Chocolate remained in the Top 10, but only 16 percent of respondents named it as an anticipated top-seller. Vanilla dropped six percentage points with only 14 percent of survey-takers expecting it to be a top-seller in 2016. Coffee, however, had larger drop as only 6 percent listed it in this year’s survey.
Both making large gains this year are blueberry and cherry. Each was named by 7 percent last year as an anticipated top-seller for 2015; however, that increased to 16 percent for 2016.
Creating success
Strategizing for the new calendar year, respondents to Beverage Industry’s survey suggest that new alcohol releases will be common for new product development in 2016.
More than half of survey-takers (56 percent) stated that their respective companies most likely will develop new wine, beer and spirit products. Water, juice was the next area listed with 40 percent of respondents naming these categories.
This is nearly double from last year’s survey in which wine, beer and spirits tied for No. 4 with water, juice with each having only 24 percent of respondents naming them.
Last year, dairy-based drinks/alternatives were listed as the most likely area of new beverage development with 42 percent of survey-takers naming this area. This year, it came in last with only 15 percent indicating possible product development for the category. Sports/energy drinks and coffee, tea also experienced drops
in comparison with the 2014 survey. This year, 19 percent of respondents named sports/energy drinks as an area of new beverage development (36 percent in 2014), while 17 percent of survey-takers listed coffee, tea (33 percent in 2014).
New product idea generation also experienced an opposite response compared with last year’s survey. Three-quarters of respondents indicated that customer demand was a source for new products while 68 percent listed consumer trends. In contrast, more than three-quarters of respondents named consumer trends followed by customer demand in the 2014 survey.
However, one of the larger changes was in research and development (R&D) departments. Last year, this idea source was No. 3 with 62 percent of respondents listing it. For this year’s respondents, it was less influential as only 42 percent named it.
Other sources that topped the R&D department were in-house through teams and meetings
(56 percent), marketing and sales (54 percent), chief executive officer/upper management (46 percent) and consumer research/testing (44 percent).
Natural influence
As consumer preferences continue to evolve, beverage-makers are tasked with meeting their needs and demands.
When it comes to flavors for 2016, an average of 83 percent of respondents note they will be using natural flavors in their formulations while a mean of 17 percent will use artificial flavors. Among those who are planning to use natural flavors, half of survey-takers note that this is an increase from the previous year. Some of the top reasons for the increase were consumer demand, health reasons and market research.
These numbers are a slight shift from last year’s survey in which an average of 70 percent of respondents indicated they would use natural-flavor in 2015 with a mean of 30 percent planning to use artificial flavors. The increase among natural flavor users last year, however, was similar to this year as 47 percent noted it was an increase. The reasons for the increase were slightly different with cleaner label, consumer demand, better quality and taste, and industry trends listed by respondents.
Natural colors also continue as a popular attribute for new product development. An average of 80 percent of respondents plan to use natural colors in their new beverages for 2016 with a mean of 20 percent using artificial colors in their new formulations. This is up from last year’s results as an average of 70 percent planned to use natural colors in 2015 with a mean of 30 percent using artificial colors.
In this year’s survey, 38 percent of those who indicated that they will use natural colors in their new products noted that this is an increase. Among the top reasons listed for the increase were consumer demand, trend in market and health reasons.
In comparison with the 2014 survey, 43 percent of respondents who indicated that they planned to use natural colors stated that this was an increase. Top reasons remained similar with consumer demand, clean label and industry trends as the reasons named.
Sharing the work
Company size among survey-takers seems to continue to represent entrepreneurial operations.
The mean and median of the number of employees for this year’s survey are 501 and 23 employees, respectively. This is slightly different from last year when survey-takers reported a mean of 201 employees and a median of 63 employees. Going back even further, this year’s employee mean and median still is significantly smaller than results from the 2013 survey in which the numbers were 1,278 and 180 employees for the mean and median, respectively.
Similar to last year’s survey, the smaller operations resulted in a more intimate setting for R&D teams. Nearly three-quarters of respondents indicated that they have fewer than 10 employees involved in the new-product-development process with a median of four employees involved. Last year, 82 percent of respondents noted having fewer than 10 employees working on new product development; however, the median of four employees being involved was consistent.
Although beverage manufacturers have dedicated teams for their new product development, they still outsource a portion of the process. One-third of respondents indicated that they outsource a portion of the work (up from 29 percent last year).
Among those who outsource part of the process, market research is outsourced by more than half (53 percent) followed by prototype development (47 percent) and concept/product testing (41 percent).
This is a notable shift from last year’s responses in which prototype development was the No. 1 outsourced process with 62 percent naming it. It was followed by concept and product testing (46 percent) and market research (38 percent).
Although team approach still is noted by a majority of respondents (82 percent), it is down from last year’s survey in which 93 percent noted this development approach.
Among those who indicated using a team approach in this year’s survey, sales/marketing (80 percent) and upper management (78 percent) were the departments involved. Other areas noted by respondents were production (56 percent), R&D (49 percent) and customers (44 percent).
Although sales/marketing was ranked No. 1 by last year’s survey-takers, R&D was No. 2 with 79 percent listing it. Upper management was No. 3 at 62 percent.
Among respondents who noted upper management involvement, 100 percent stated that the chief executive officer was included in that process compared with 88 percent in 2014. When noting the roles of chief executive officers, 41 percent said leader/decision-maker followed by oversees/advisory/guidance, which was listed by a quarter of survey-takers. Last year, slightly more than a quarter noted oversees/advisory/guidance as the chief executive officer’s role. Slightly more than a quarter of 2014 survey-takers also listed team member.
Beverage-makers also continue to get input from their supplier partners. Slightly less than half of respondents indicated that they involve their suppliers in the new product development process. This is down from last year in which 58 percent noted supplier involvement.
Among those who work with their suppliers, three-quarters of survey-takers note involvement with samples followed by provide raw materials/ingredients (71 percent) and technical support/expertise (67 percent).
Inception/idea stage through completion and beginning stage through completion were the two most-noted stages in which suppliers were involved at 38 and 46 percent, respectively. Only 17 percent indicated involving suppliers after formulation through completion, while no respondents added supplier input in the final stages.
However, the length of time to develop a new product seems to be moving at a faster pace as 8.2 months was the average product development timeframe, with a quarter of respondents noting this was faster than previous years. Last year, mean product development timeframe from inception to launch was 11 months with less than one-third indicating that was faster than in the past.
All of these processes might keep beverage-makers busy, but that is not holding them back. On average, 21 new products were developed in 2015 with approximately 12 being released in market, an average of 55 percent of developed products were released. Of those released, an average of nearly two were considered successful in 2015, which equates to a 7 percent average of successful products developed and a 13 percent average of successful products of those released.
In comparison, a mean of 24 products were developed in 2014 with an average of nine that were released, a 38 percent average of products released of those developed. Among those, a mean of five products were considered successful in 2014. This equated to a 21 percent average of successful products of those developed and a 56 percent average of successful products of those released.
2016 expectations
As beverage-makers usher in the new year, new product development is on many minds.
Half of respondents indicated that they plan to launch more products into the marketplace in 2016 compared with 2015. Among those who expect to see an increase of new product launches, the average percentage increase of product launches is 57 percent.
Last year’s respondents had slightly more than half note intentions to launch more products in 2015 than 2014; however, the average percentage increase only was 38 percent.
Planning remains split as half of survey-takers have a definitive new-product-development plan; however, assessment has a slightly higher uptick with 60 percent of respondents who have post-launch assessments. In comparison, 60 percent had definitive plans and 76 percent had post-launch assessments in the 2014 survey.
One area that continues to show strong variances among survey-takers is total cost to develop new products. With a recorded minimum of $100 and maximum of $2 million, 41 percent of new products fall in the $1,000-$19,000 range. The median total cost came to $17,500. This is strong contrast to last year’s survey in which the recorded minimum was $50 with the maximum at $1.5 million, with the median total cost at $37,500.
When it came to R&D budgets, respondents this year also stipulated a lower price tag as only 32 percent planned to increase their budget compared with 44 percent last year. BI
Beverage Industry’s New Product Development survey was conducted by BNP Media’s Market Research Division. The online survey was conducted between Oct. 22 and Nov. 6, 2015, and included a systematic random sample of the domestic circulation of Beverage Industry.
Of the respondents, 34 percent process beer, 28 percent process coffee and tea, 26 percent process juice and juice-type drinks, 22 percent process water, 22 percent process wine, 20 percent process spirits, 16 percent process energy drinks, 12 percent process dairy-based drinks, 12 percent process carbonated soft drinks and 8 percent process sports drinks.
Seventy percent of respondents were from companies with less than $10 million in annual revenue. Another 8 percent of respondents also were from companies with revenue between $10 million and $50 million. A total of 2 percent were from companies in the mid-size range of $50 million to less than $100 million. Ten percent were from companies with revenue between $100 million to less than $500 million. In the $500 million to less than $1 billion range were 2 percent of respondents. Representing the large-size range of more than $1 billion in company revenue were 8 percent of respondents.
Males accounted for 72 percent of the respondents, and the average age equated to 44. For industry experience, 2 percent had less than one year; 14 percent indicated one to three years; 36 percent reported four to 10 years; 22 percent said 11-20 years; 20 percent listed 21-30 years; and 6 percent had 31-40 years of experience.
Regionally, 32 percent said they currently live in the South, 24 percent indicated the Midwest, 20 percent listed the Northeast, 20 percent reported living in the Western portion of the United States and 4 percent stated they reside in U.S. territories.
Looking for a reprint of this article?
From high-res PDFs to custom plaques, order your copy today!


