2018 Beer Report: Beer market looking to stem alcohol migration trends
Flavor offerings could benefit domestic beer sales
The “Philly Special” reverse touchdown pass during Super Bowl LII has been touted by many sports analysts as the play that defined the Philadelphia Eagles’ victory over the New England Patriots. But creative game plans against the competition are not unique to the football field. Migration trends across the alcohol beverage market have challenged the beer category.
In a May 2017 Insights from New York-based Nielsen titled “The State of the U.S. Beer Market,” the market research firm highlights that Americans spent more than $37 billion on beer during the year-end period of Feb. 25, 2017, across Nielsen-measured channels. Although the beer market maintains its dominance, Nielsen notes that the category benefited more from pricing strategies than consumption trends.
“Despite the massive scale of the category, however, sales growth in recent times has largely been due to pricing rather than increased consumption,” the Insights states. “In fact, beer has lost some of its footing over the past five years or so, with consumers across generations spending more on wine and spirts without increasing their overall alcoholic beverage spending.”
In Chicago-based Mintel’s October 2017 report titled “Beer and Craft Beer – US,” the market research firm reports that when compared with other alcohol beverage categories, a higher percentage of beer consumers reported drinking less beer in 2017 and named various reasons for the shift.
(Brand family)
| DOLLAR SALES | % CHANGE VS. PRIOR YEAR | CASE SALES | % CHANGE VS. PRIOR YEAR | |
| Bud | $7,725,972,726 | -4.6 | 364,392,311 | -5.5 |
| Coors | $2,625,503,275 | -0.9 | 126,085,689 | -1.9 |
| Miller Lite | $2,034,585,556 | -0.6 | 98,588,054 | -1.5 |
| Yuengling | $385,349,101 | 3.8 | 16,606,383 | 1.1 |
| Rolling Rock | $142,461,764 | 4 | 8,524,107 | 8.8 |
| Total sales* | $13,159,538,067 | -2.9 | 627,019,410 | -3.8 |
Source: Information Resources Inc. (IRI), Chicago. Total U.S. supermarkets, drug stores, gas and convenience stores, mass merchandisers, military commissaries, and select club and dollar retail chains for the 52 weeks ending Dec. 31, 2017.
“Thirty-one percent of respondents who are drinking less beer in the past year say it’s because they are drinking more wine, 23 percent say it’s because they are drinking more spirits, and 21 percent say it’s because they are drinking more cocktails/mixed drinks,” the report states. “Retaining participation will be key to stemming ongoing sales declines.”
Despite the challenges facing the beer market, Chicago-based Information Resources Inc. (IRI) data shows that case sales were relatively flat, as they were down 0.4 percent for the 52 weeks ending Dec. 31, 2017, across total U.S. multi-outlets.
(Brand family)
| DOLLAR SALES | % CHANGE VS. PRIOR YEAR | CASE SALES | % CHANGE VS. PRIOR YEAR | |
| Michelob | $1,786,900,547 | 22.4 | 68,187,569 | 19.1 |
| Bud Specialty | $689,340,377 | -6.5 | 22,961,876 | -9 |
| Landshark | $46,308,244 | 9.8 | 1,695,905 | 13 |
| George Killians | $14,876,505 | -13.9 | 559,547 | -14.3 |
| Henry Weinhards | $9,175,735 | -21.8 | 349,233 | -25.4 |
| Total sales* | $2,554,961,823 | 11.3 | 94,139,512 | 9.4 |
Source: Information Resources Inc. (IRI), Chicago. Total U.S. supermarkets, drug stores, gas and convenience stores, mass merchandisers, military commissaries, and select club and dollar retail chains for the 52 weeks ending Dec. 31, 2017.
“The market is relatively flat with per capita consumption declining modestly and value expanding due to mix,” says Brian Sudano, managing partner with New York-based Beverage Marketing Corporation (BMC).
Domestic adjustments
With dollar sales exceeding $25.2 billion for the 52 weeks ending Dec. 31, 2017, domestic beer accounted for nearly three-quarters of the overall $34.4 billion total beer category sales in 2017, based on IRI data.
(Brand family)
| DOLLAR SALES | % CHANGE VS. PRIOR YEAR | CASE SALES | % CHANGE VS. PRIOR YEAR | |
| Busch | $1,525,911,220 | -0.5 | 96,926,540 | -0.6 |
| Natural | $1,323,582,531 | -2.9 | 83,599,823 | -2.4 |
| Keystone | $472,214,446 | 5.5 | 32,203,306 | 9.8 |
| Miller High Life | $469,568,185 | 0.7 | 28,856,086 | -0.5 |
| Bud Ice | $324,413,876 | 4.6 | 18,651,683 | 6.8 |
| Total sales* | $5,493,767,546 | -1.1 | 343,804,722 | -0.8 |
Source: Information Resources Inc. (IRI), Chicago. Total U.S. supermarkets, drug stores, gas and convenience stores, mass merchandisers, military commissaries, and select club and dollar retail chains for the 52 weeks ending Dec. 31, 2017.
IRI calculates the total domestic beer segment based on four sub-segments: domestic premium, domestic super-premium, domestic sub-premium and craft. Among the commonly associated domestic sub-segments — premium, super-premium and sub-premium — performance fluctuated.
Premium and sub-premium both registered dollar and case sales declines; however, super-premium saw dollar sales up double-digits and case sales were shy of 10 percent growth in the 52 weeks ending Dec. 31, 2017. This sales data supports trend shifts that analysts have recognized in the U.S. beer market.
“[A]ll the growth in beer over the past five to 10 years has been in the high end, led by craft beer, which is more fragmented and flavorful,” BMC’s Sudano says. “This is where the consumer is moving.”
Mintel’s report highlights that the beer category trails other alcohol categories in flavor utilization, which could hold value when competing with these markets. “The category will need to improve its taste offerings in order to fend off competition from the likes of wine and cocktails,” the report states. “The increasing array of flavored beer launches is likely the result of an attempt to fill this void.”
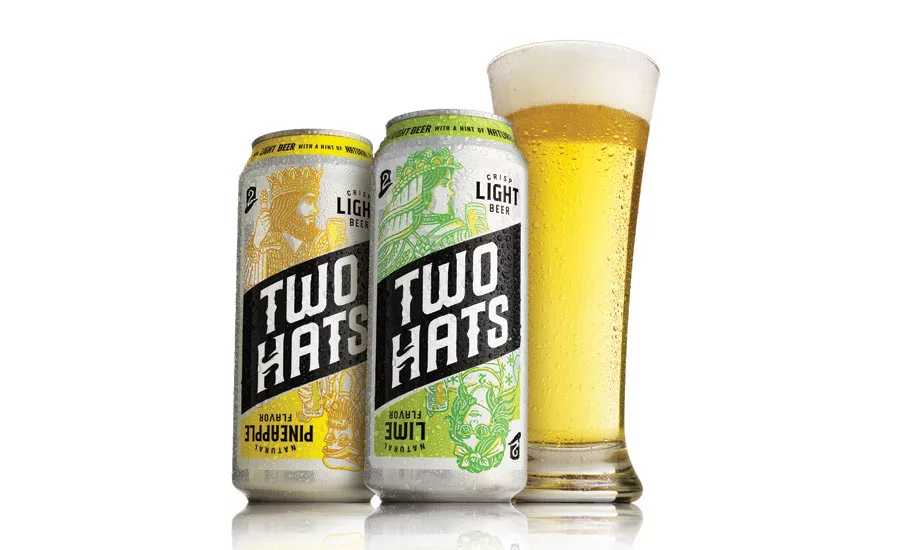
Supporting this trend, Chicago-based MillerCoors, a division of Molson Coors Brewing Co., recently released Two Hats, a line of light beers brewed with a hint of natural flavor. Available in Lime and Pineapple, the 4.2 percent alcohol-by-volume beers are packaged in six-packs of 16-ounce cans. BI
Looking for a reprint of this article?
From high-res PDFs to custom plaques, order your copy today!


