2017 State of the Beverage Industry: Steady demand drives energy drinks market
Flavor innovations impact energy drinks
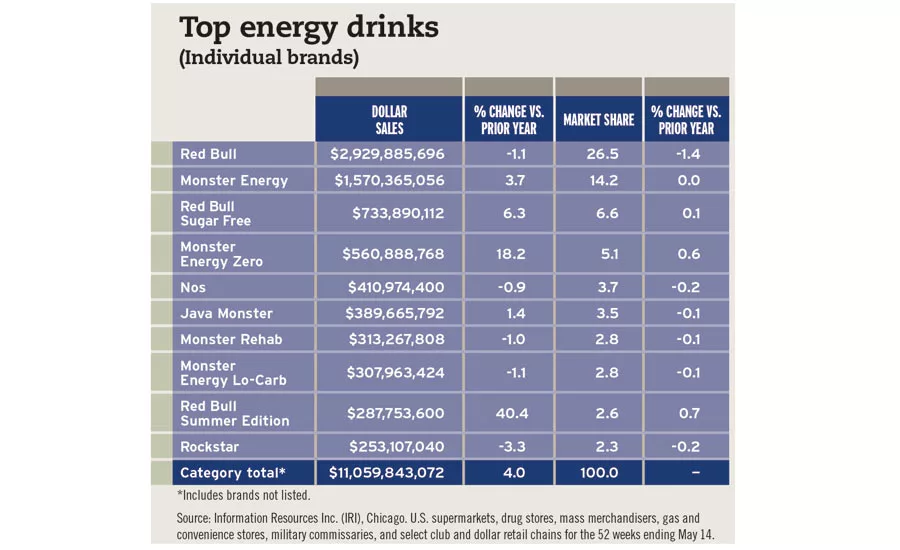
The promise of a convenient, on-the-go caffeinated beverage, along with more flavor choices and natural ingredients, continues to drive the energy drinks market. The non-aseptic energy drinks category saw a sales increase of 4 percent to just more than $11 billion in U.S. multi-outlets and convenience stores for the 52 weeks ending May 14, according to data from Information Resources Inc. (IRI), Chicago.
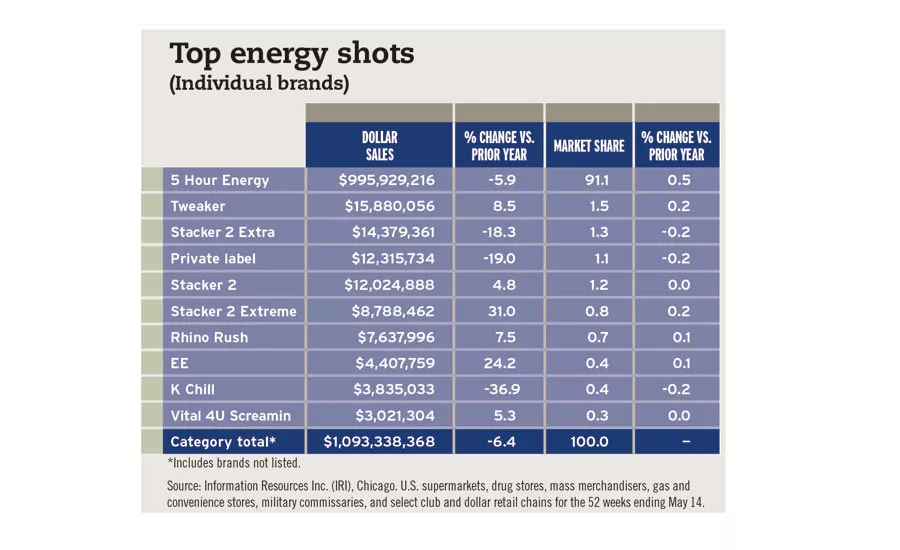
On the other hand, the energy shots category notched slightly more than $1 billion in sales for the same time period; however, it experienced a deceleration of 6.4 percent, IRI data indicates.
With $2.9 billion in sales, Red Bull, a brand of Santa Monica, Calif.-based Red Bull North America Inc., is the highest-selling energy drink, and Monster Energy, a brand of Corona, Calif.-based Monster Beverage Corp., is No. 2 with $1.5 billion in sales, according to IRI data.
New York-based Beverage Marketing Corporation’s (BMC) November 2016 report titled “U.S. Energy Drinks through 2020” highlights the growth of this category across all channels.
“Wholesale sales of energy drinks were $7.3 billion in 2015, an increase of $633.1 million versus the $6.6 billion posted in 2014," the report states. "Retail dollar sales increased by 9.8 percent to $13.1 billion.”
The market research firm expects this growth to continue through 2020. “The energy drink market should continue to enjoy solid gains to 2020,” its report states. “Wholesale dollar sales are anticipated to advance at a 7.6 percent compound annual growth rate (CAGR) to finish 2020 at $10.5 billion. Although retail dollars won’t grow as fast from a percentage standpoint, 2020’s anticipated sales of $18.5 billion would not be anything to sneeze at.”
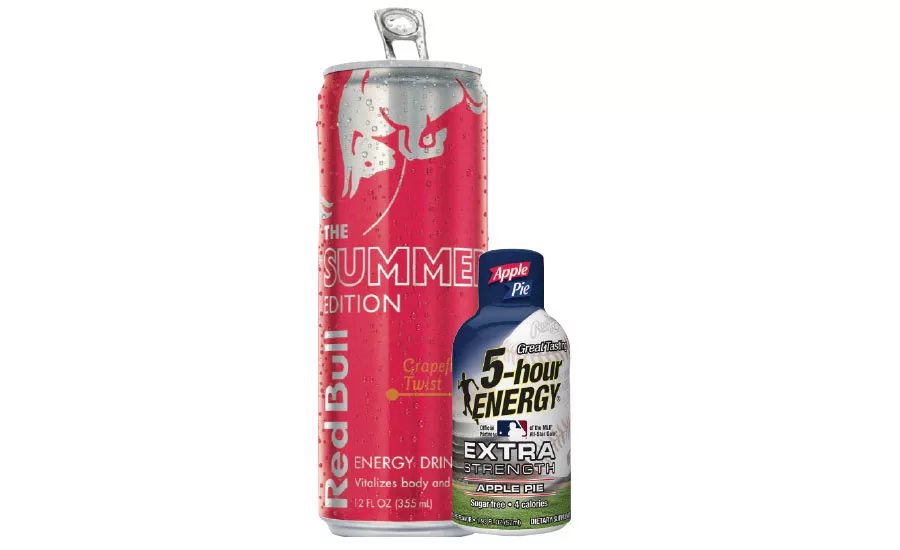
Experts note that fresh fruit flavors such as kiwi, tropical fruit and cherry are addressing consumers’ current flavor preferences. Red Bull has addressed these and other flavor trends through its Edition lineup and continue to leave a mark on the category.
In the August 2016 issue of Beverage Industry, IRI’s Vice President of Thought Leadership Susan Viamari noted that the Red Bull Yellow Edition, released in the first half of 2015, was an IRI New Product Pacesetter (NPP).
“It was too new to the market to be considered for Pacesetter status because it finished its first full year in the market in 2016,” she explained. “It is likely to be an IRI New Product Pacesetter in 2017 (or analysis of 2016 performance).
“Red Bull Summer Edition and Monster Energy Ultra are top performers in the market, showing triple-digit growth,” she continued. “Monster Energy Ultra Sunrise was a 2016 IRI NPP because it was among the 100 highest-earning beverage launches of 2015. Red Bull Editions was a 2015 NPP. These brands continue to extend, bringing new flavors/varieties into the market to satisfy consumers’ changing palates.”
The Red Bull Summer Edition saw its market share increase more than 40 percent year-over-year in the 52 weeks ending May 14, states IRI data.
In its May 2016 report titled “Energy Drinks US,” Chicago-based Mintel noted that the energy shot segment has struggled since 2011. “Energy shots experienced an estimated 4 percent sales decline in 2015, hitting $1.18 billion,” it states. “Future growth is expected to remain stagnant … decreasing an additional 1.8 percent in the period from 2015-2020.”
With a 91 percent share of the market, 5-Hour Energy, a brand of Farmington Hills, Mich.-based Living Essentials LLC, is dominating the energy shot segment, according to IRI data.
Although the products also offer energy solutions, BMC's report highlights that energy shots' merchandising and demographic vary greatly from energy drinks. "Energy shots tend to appeal to older consumers — mostly men — looking for a quick source of energy but may not be inclined to energy drinks, which are targeted to teens that enjoy them also for the taste and refreshment," the report states. BI
Top energy drinks
(Individual brands)
| Red Bull | $2,929,885,696 | -1.1 | 26.5 | -1.4 |
| Monster Energy | $1,570,365,056 | 3.7 | 14.2 | 0.0 |
| Red Bull Sugar Free | $733,890,112 | 6.3 | 6.6 | 0.1 |
| Monster Energy Zero | $560,888,768 | 18.2 | 5.1 | 0.6 |
| Nos | $410,974,400 | -0.9 | 3.7 | -0.2 |
| Java Monster | $389,665,792 | 1.4 | 3.5 | -0.1 |
| Monster Rehab | $313,267,808 | -1.0 | 2.8 | -0.1 |
| Monster Energy Lo-Carb | $307,963,424 | -1.1 | 2.8 | -0.1 |
| Red Bull Summer Edition | $287,753,600 | 40.4 | 2.6 | 0.7 |
| Rockstar | $253,107,040 | -3.3 | 2.3 | -0.2 |
| Category Total* | $11,059,843,072 | 40.01 | 100 | - |
*Includes brands not listed.
Source: Information Resources Inc. (IRI), Chicago. Total U.S. supermarkets, drug stores, gas and convenience stores, mass merchandisers, military commissaries, and select club and dollar retail chains for the 52 weeks ending May 14.
Top energy shots
(Individual brands)
| 5 Hour Energy | $995,929,216 | -5.9 | 91.1 | 0.5 |
| Tweaker | $15,880,056 | 8.5 | 1.5 | 0.2 |
| Stacker 2 Extra | $14,379,361 | -18.3 | 1.3 | -0.2 |
| Private label | $12,315,734 | -19.0 | 1.1 | -0.2 |
| Stacker 2 | $12,024,888 | 4.8 | 1.2 | 0.0 |
| Stacker 2 Extreme | $8,788,462 | 31.0 | 0.8 | 0.2 |
| Rhino Rush | $7,637,996 | 7.5 | 0.7 | 0.1 |
| EE | $4,407,759 | 24.2 | 0.4 | 0.1 |
| K Chill | $3,835,033 | -36.9 | 0.4 | -0.2 |
| Vital 4U Screamin | $3,021,304 | 5.3 | 0.3 | 0.0 |
| Category Total* | $1,093,338,368 | -6.4 | 100 | - |
*Includes brands not listed.
Source: Information Resources Inc. (IRI), Chicago. Total U.S. supermarkets, drug stores, gas and convenience stores, mass merchandisers, military commissaries, and select club and dollar retail chains for the 52 weeks ending May 14.
Looking for a reprint of this article?
From high-res PDFs to custom plaques, order your copy today!


