2017 State of the Beverage Industry: Steady growth in wine, spirits
Dark spirits, sparkling wines lead category


Within the wine and spirits markets, dark spirits, sparkling wines and red blends are leading growth, according to analysts. The whiskey segment saw volume increase 6.8 percent to 21.8 million cases and revenues grow 7.7 percent to $3.1 billion in 2016, according to the Washington, D.C.-based Distilled Spirits Council.
The spirits industry experienced accelerated growth for the seventh straight year, with supplier sales up 4.5 percent, volume up 2.4 percent and retail sales of nearly $78 billion in 2016. Much of the growth has been fueled by high-end and super-premium Irish whiskeys, which grew 736 and 3,456 percent, respectively, since 2002, according to the association.
“Increased growth of premium Irish whiskey reflects the upward trend of adult consumers’ interest in luxury spirits products,” Distilled Spirits Council Senior Vice President Frank Coleman said in a statement.
Other segments also experienced strong volume growth, including cognac, up 12.9 percent; tequila, up 7.1 percent; and vodka, was up 2.4 percent for annual sales of $6 billion last year, the association says.
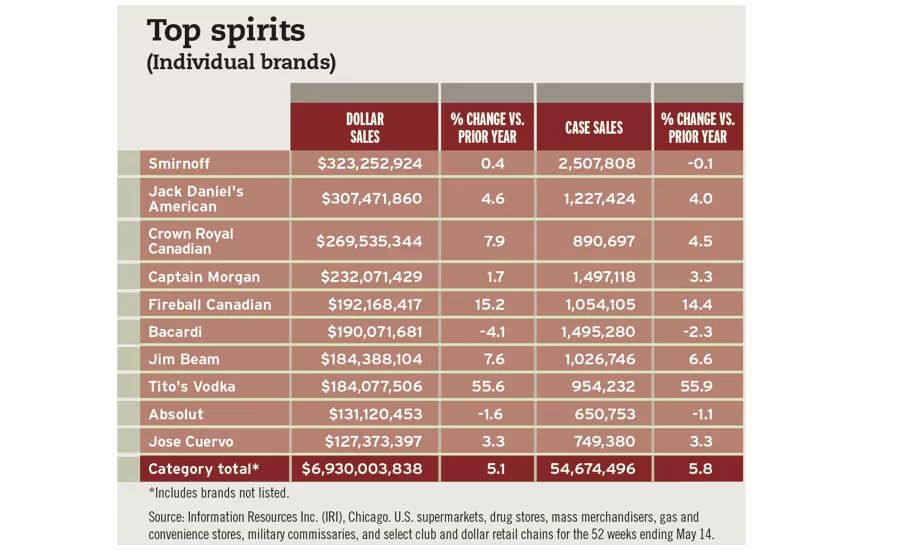
The overall spirits category amassed $6.9 billion in sales, a 5.1 percent increase compared with the previous year, and case sales were up 5.8 percent to more than 54.6 million for the 52 weeks ending May 14 in U.S. multi-outlets and convenience stores, according to Chicago-based Information Resources Inc. (IRI). Although smaller in comparison to other spirit segments, ready-to-drink premixed cocktails were up 23.5 percent to more than $310 million in sales for the same time period.
Premium and super-premium positioning, along with flavor innovation, have led to “notable growth” for the dark spirits category, with fruit, spice, sweetened, vanilla and dessert flavors among the top choices of millennials, according to Chicago-based Mintel in its October 2016 “White Spirits – US” report.
Mintel’s Senior Food and Drink Analyst Billy Roberts noted the importance of the millennial consumer base in this market. “Older millennials are core dark spirits consumers, have broader beverage repertoires in general and enjoy new or culinary experiences, all of which positions them as active dark spirits drinkers,” he said in Beverage Industry’s April issue.
The wine category also is benefiting from consumers’ interest in fine wine as the market has grown “at mid-single-digit rates on dollars [and] smaller single-digit rates on volume as consumers continue to trade up to more expensive wines,” said Danny Brager, senior vice president of beverage alcohol for New York-based Nielsen, in Beverage Industry’s February issue.
Susan Viamari, vice president of Thought Leadership for IRI added: “The wine market is on a positive growth trajectory during the past several years. Imported wines outplaced domestic through 2015 and the first half of 2016,” she says. “Dollar sales in 2016 increased 5.9 percent [for] domestic and 4.4 percent [for] imported. In 2015, domestic wines grew 8 percent and imported grew 6.2 percent.”
IRI data notes that table wines had sales of more than $10 billion in U.S. multi-outlets and convenience stores for the 52 weeks ending May 14, a 3.6 percent increase year-over-year, while sparkling wines and Champagnes generated sales of more than $1 billion, a 9.7 percent increase for the same timeframe.
Analysts also highlight the rise of red blends and consumers’ fascination with bubbles. “Cabernet Savignon, red blends [and] Pinot Grigio have led the way,” said Eric Schmidt, director of alcohol research at New York-based Beverage Marketing Corporation, in Beverage Industry’s February issue. “… A category that continues to outperform the market is sparkling wine, both U.S. sparklers and ones from abroad, including Champagne, Cavas and Proseccos.” BI
Top spirits
(Individual brands)
| Smirnoff Vodka | $323,252,924 | 0.4 | 2,507,808 | -0.1 |
| Jack Daniels American Whiskey | $307,471,860 | 4.6 | 1,227,424 | 4.0 |
| Crown Royal Canadian | $269,535,344 | 7.9 | 890,697 | 4.5 |
| Captain Morgan Rum | $232,071,429 | 1.7 | 1,497,118 | 3.3 |
| Fireball Canadian | $192,168,417 | 15.2 | 1,054,105 | 14.4 |
| Bacardi Rum | $190,071,681 | -4.1 | 1,495,280 | -2.3 |
| Jim Beam American | $184,388,104 | 7.6 | 1,026,746 | 6.6 |
| Tito's Vodka | $184,077,506 | 55.6 | 954,232 | 55.9 |
| Absolut Vodka | $131,120,453 | -1.6 | 650,753 | -1.1 |
| Jose Cuervo | $127,373,397 | 3.3 | 749,380 | 3.3 |
| Category Total* | $6,930,003,838 | 5.1 | 54,674,496 | 5.8 |
*Includes brands not listed.
Source: Information Resources Inc. (IRI), Chicago. Total U.S. supermarkets, drug stores, gas and convenience stores, mass merchandisers, military commissaries, and select club and dollar retail chains for the 52 weeks ending May 14.
Top table wines
(Individual brands)
| Barefoot | $672,663,593 | 3.2 | 10,099,980 | 3.7 |
| Sutter Home | $369,132,754 | 2.9 | 5,637,827 | 1.6 |
| Franzia | $340,586,964 | 1.8 | 12,411,705 | 1.2 |
| Woodbridge by Robert Mondavi | $339,257,784 | 3.4 | 5,133,297 | 3.8 |
| Yellow Tail | $267,000,322 | -2.5 | 3,998,515 | -1.0% |
| Kendall Jackson Vintners Reserve | $192,917,503 | -3.1 | 1,331,133 | -4.1% |
| Apothic | $185,878,725 | 23.6 | 1,629,322 | 22.9 |
| Black Box | $181,104,866 | 38.8 | 3,010,873 | 38.6 |
| Chateau Ste. Michelle | $178,685,833 | 4.4 | 1,505,575 | 3.9 |
| Menage á Trois | $175,272,436 | 3.8 | 1,501,400 | 3.0 |
| Category Total* | $10,072,316,284 | 3.6 | 126,586,742 | 1.8 |
*Includes brands not listed.
Source: Information Resources Inc. (IRI), Chicago. Total U.S. supermarkets, drug stores, gas and convenience stores, mass merchandisers, military commissaries, and select club and dollar retail chains for the 52 weeks ending May 14.
Looking for a reprint of this article?
From high-res PDFs to custom plaques, order your copy today!


