2017 State of the Beverage Industry: No added sugar, fortification in demand for juice, juice drinks
Category challenged by sugar content

The juice and juice drinks category has been challenged to maintain its share of the beverage market as consumers look for products that contain less sugar. On the upswing, juice concentrates experienced dollar sales increases of 4.5 percent for the 52 weeks ending May 14 in U.S. multi-outlets and convenience stores, and shelf-stable bottled juices were up 1.1 percent for the same timeframe, according to Chicago-based Information Resources Inc. (IRI). However, IRI data indicates that dollar sales for aseptic juices were down 0.7 percent, canned juices were down 1.6 percent and refrigerated juice/juice drinks were down 1.5 percent.
“Volume sales in the U.S. continued to decline in 2016 as consumers turned away from juices due to concerns about their high sugar content,” states Chicago-based Euromonitor International in its February 2017 report titled “Juice in the US.” “… In spite of this decline, areas of opportunity in the juice category have been seen, particularly in the premium segment via ‘raw juices’ (unpasteurized), cold-pressed (or HPP) juices, fringe juices like coconut water and other plant waters, and juice smoothies. While also affected by a high sugar content, the natural and healthy positioning of these juices has enabled them to prosper, driving up average unit price by 2 percent in 2016.”
Market research experts note that the U.S. Food and Drug Administration’s new Nutrition Facts label, which will update serving sizes to reflect the amount that consumers typically will consume and adds an Added Sugar section under the Total Sugars section, could have an impact on the category.
“The new labels propose separating added sugar from total sugars,” the Euromonitor report states. “Although most juices are high in sugar, if consumers are more easily able to differentiate between products with naturally occurring sugar and those with added sugar, some juice categories may be able to shed some of the perceptions of offering unhealthy beverages.”
In Beverage Industry’s January issue, Andrew Mandzy, director of strategic insights at New York-based Nielsen, added: “The additional metrics of added sugars will create yet another data point for consumers to consider as they make decisions about their health and wellness. As of today, only 12 percent of sales in the category have a claim that says ‘No Added Sugars.’”
On the other hand, the trendtoward premiumized products has benefited the category. Super-premium juice wholesale dollar sales grew
11 percent to $2.2 billion, according to New York-based Beverage Marketing Corporation’s (BMC) November 2016 report titled “U.S. Single-Serve Fruit Beverages through 2020.” The market research firm predicts wholesale dollars in the super-premium segment to grow to $3.2 billion by 2020.
In line with this, natural and organic juices are gaining. “This trend shows up fairly clearly in the data, as sales of natural and organic juices are up
7 percent and 23 percent, respectively,” said Nielsen’s Mandzy in Beverage Industry’s January issue. “In addition, GMO-free sales in shelf-stable juices are up over 30 percent compared to a year ago.”
As consumers look for less sugars and premium juice products, they’re also demanding products that provide value-added benefits. Innovation within the juice and juice drinks segment will help maintain and further drive consumer interest, market research experts say.
“When it comes to juices, consumers are clear about what matters,” Mandzy said in Beverage Industry’s January issue. “When asked which attributes influence purchasing decisions in juices, 36 percent of consumers stated that natural ingredients impact their buying behavior, 37.9 percent stated low sugar has an impact, and 33.6 percent stated that health benefits are important. In addition to that, consumers want to trust the brands they engage with in juices, as over 44 percent stated that trusting the brand has an influence on purchasing decisions.” BI
Top shelf-stable bottled tomato/vegetable juice/cocktail
(Individual brands)
| V8 | $261,202,720 | -3.9 | 57.3 | -1.4 |
| Motts Clamato | $97,440,488 | 2.9 | 21.4 | 0.9 |
| Private label | $45,181,672 | 2.0 | 9.9 | 0.3 |
| Campbells | $29,323,220 | 0.7 | 6.4 | 0.1 |
| V8 Splash | $3,264,060 | -16.8 | 0.7 | -0.1 |
| Category Total* | $455,559,520 | -1.5 | 100.0 | - |
*Includes brands not listed.
Source: Information Resources Inc. (IRI), Chicago. Total U.S. supermarkets, drug stores, gas and convenience stores, mass merchandisers, military commissaries, and select club and dollar retail chains for the 52 weeks ending May 14.
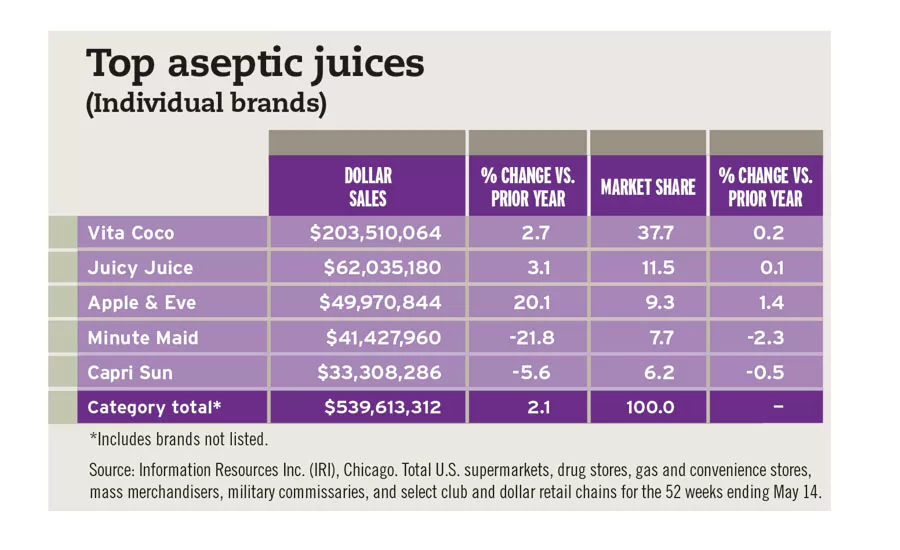
Top aseptic juices
(Individual brands)
| Vita Coco | $203,510,064 | 2.7 | 37.7 | 0.2 |
| Juicy Juice | $62,035,180 | 3.1 | 11.5 | 0.1 |
| Apple & Eve | $49,970,844 | 20.1 | 9.3 | 1.4 |
| Minute Maid | $41,427,960 | -21.8 | 7.7 | -2.3 |
| Capri Sun | $33,308,286 | -5.6 | 6.2 | -0.5 |
| Category Total* | $539,613,312 | 2.1 | 100.0 | - |
*Includes brands not listed.
Source: Information Resources Inc. (IRI), Chicago. Total U.S. supermarkets, drug stores, gas and convenience stores, mass merchandisers, military commissaries, and select club and dollar retail chains for the 52 weeks ending May 14.
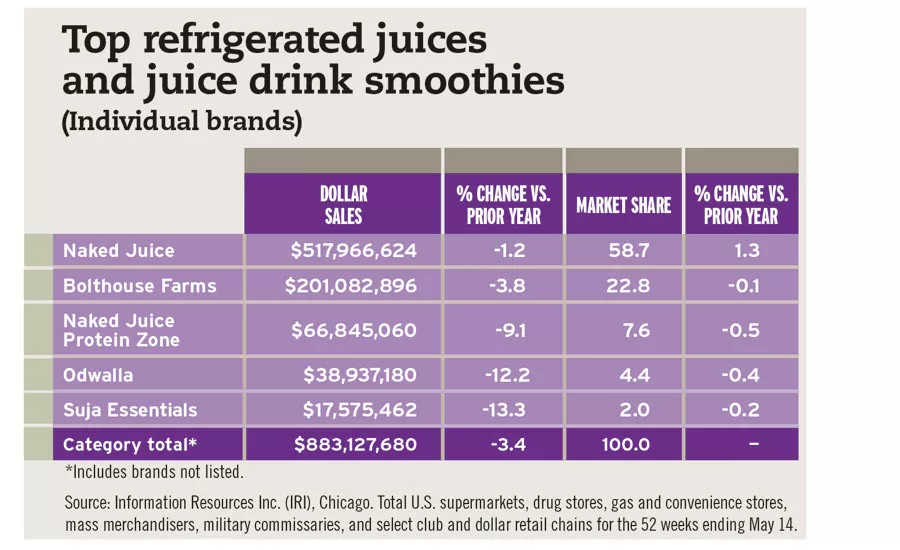
Top refrigerated juice and juice drink smoothies
(Individual brands)
| Naked Juice | $517,966,624 | -1.2 | 58.7 | 1.3 |
| Bolthouse Farms | $201,082,896 | -3.8 | 22.8 | -0.1 |
| Naked Juice Protein Zone | $66,845,060 | -9.1 | 7.6 | -0.5 |
| Odwalla | $38,937,180 | -12.2 | 4.4 | -0.4 |
| Suja Essentials | $17,575,462 | -13.3 | 2.0 | -0.2 |
| Category Total* | $883,127,680 | -3.4 | 100.0 | - |
*Includes brands not listed.
Source: Information Resources Inc. (IRI), Chicago. Total U.S. supermarkets, drug stores, gas and convenience stores, mass merchandisers, military commissaries, and select club and dollar retail chains for the 52 weeks ending May 14.
Looking for a reprint of this article?
From high-res PDFs to custom plaques, order your copy today!


