The 2016 State of the Beverage Fleet Industry
Small vans continue to gain in popularity

Beverage Industry conducted its annual fleet survey to get the latest data on the size and makeup of current delivery fleets as well as operational concerns and strategies. Continuing trends in this year’s results include the popularity of small vans, as well as the continuing split in favor of end-load trucks and trailers versus traditional side-load equipment.
Reflecting a positive outlook in the industry, vehicle replacement cycles appear to be trending shorter, and near-term vehicle purchase plans are on the upswing.
Vehicle choices
The split between passenger vehicles (sedans, SUVs) and light trucks (pickups, small/large vans) continues to widen in favor of light trucks in part supported by the expanding variety in the small and large van segments, increasingly popular choices for multi-role use by sales, merchandising and service personnel.
The shift from side-load to end-load equipment and from straight-trucks to tractor-trailers continues to be reflected in survey responses as well.
Compared with last year, survey respondents indicated a higher level of new vehicle purchases planned for the next 24 months. Of those who are planning new vehicle purchases, two-thirds are replacing existing vehicles, while one-third are expanding fleets.
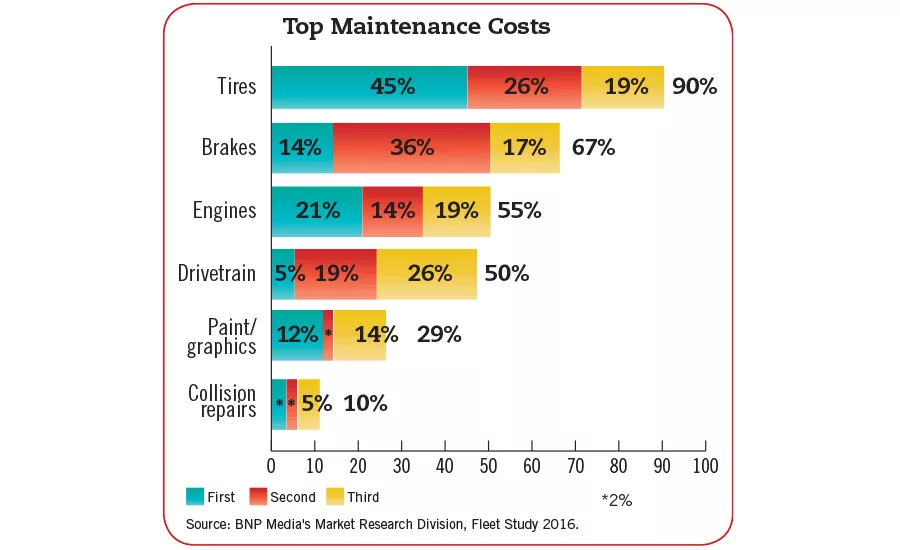
Maintenance & downtime
Tires continue to be ranked as the top maintenance cost for the majority of respondents as 90 percent listed this as a top concern. Among those respondents, 45 percent listed it as their first maintenance cost followed by 26 percent naming it second and 19 percent listing it as third.
Brakes moved up to No. 2 on this list as 67 percent of respondents view this as a top maintenance cost. However, a larger portion of respondents (36 percent) indicated this is their second top cost compared with the 14 percent that listed it as their first cost. Seventeen percent named brakes as their third top maintenance cost.
In third place, engine maintenance still is a top cost among more than half of the respondents (55 percent), likely fueled by longer replacement cycles that now are beginning to turn around.
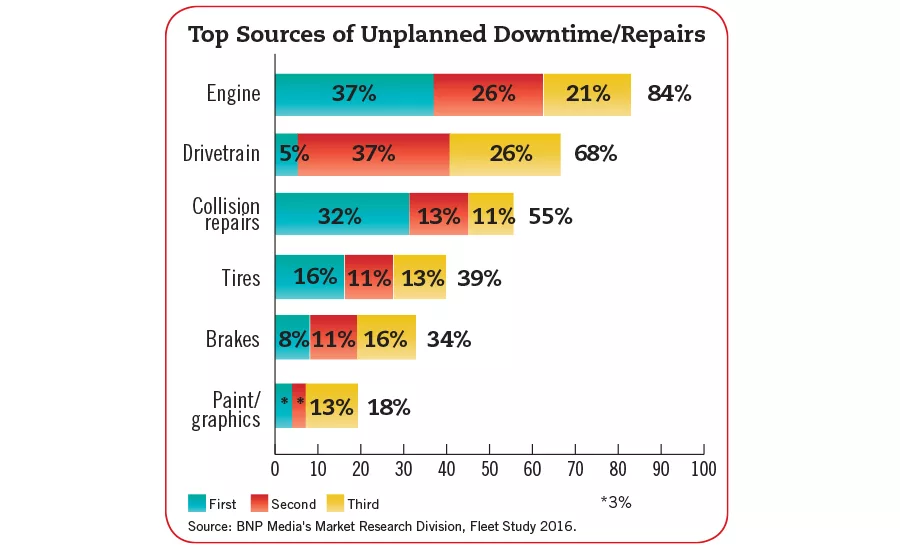
Engine and drivetrain failures still rank high among top causes of downtime/unplanned repairs with 84 and 68 percent of respondents listing these causes, respectively. This likely is another symptom of replacement cycles that were stretched to the limit in recent years.
Collision repairs continue to be ranked high by more than half of survey respondents (55 percent). Although this might be related to driver hiring challenges, it’s important to remember that, in purely relative terms, collision repair should rank high on the unplanned repair scale, as most other types of repairs can be scheduled to avoid downtime when properly managed.
Operational concerns
Likely related to the ongoing stability of fuel prices, fuel price volatility saw a decrease in the percentage of respondents that listed it as top operational concern (60 percent in 2016 vs. 65 percent in 2015); however it continues to rank among the top operational concerns of respondents. While it still is a significant concern, the options that best address price volatility rank low among fuel cost reduction strategies.
Trading places in the first- and second-place ranking, insurance cost and vehicle lifecycle costs continue to outrun other operational concerns by a wide margin. This heightened cost-sensitivity likely reflects the smaller company size of this year’s respondents.
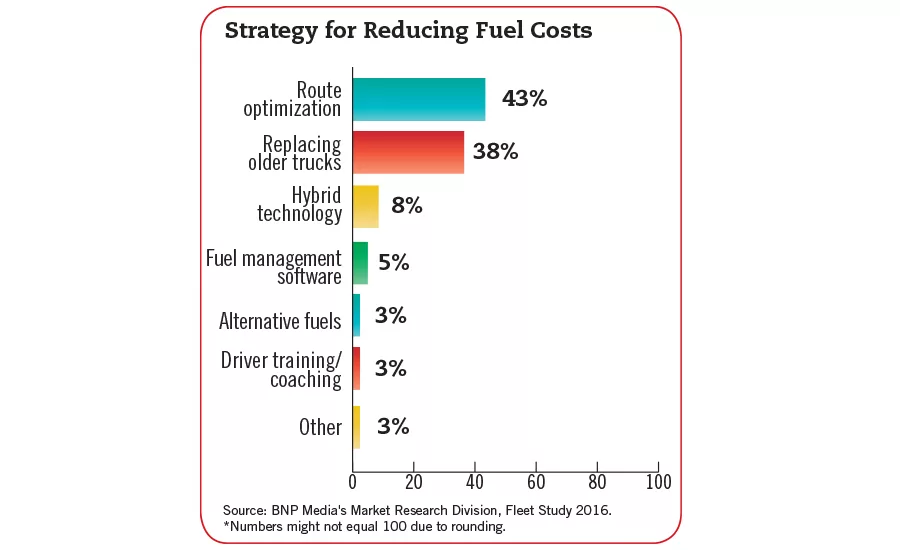
Fuel cost strategies
As expected, route optimization remains the most popular fuel cost reduction strategy among respondents. However, providing evidence of the turnaround in replacement cycle strategies, replacing older trucks as a means of reducing fuel costs has grown more than four-fold in popularity since last year.
Driver training/coaching, one of the lowest-cost options, has moved down to a last-place tie among fuel cost reduction strategies. Considering that a driver can impact fuel economy by as much as 30 percent, employing driver training/coaching still warrants more consideration as a fuel-saving strategy. BI
Beverage Industry’s Fleet Survey was conducted by BNP Media’s Market Research Division. The online survey was conducted between Sept. 1 and 14 and included a systematic random sample of the domestic circulation of Beverage Industry.
Geographically, the respondents were well distributed across the United States, with slightly stronger representation from the Southern region compared with the Midwest, West Coast and Northeastern regions. No U.S. territories were included in this survey. Forty percent of the respondents were distributors/wholesalers, while 38 percent labeled themselves as a producer/bottler. Thirteen percent of respondents indicated that they operated in the retail industry, and the remaining 9 percent listed other for their industry involvement.
When it comes to company size, nearly one-third of respondents reported annual sales revenue between $1 million and $10 million, and 20 percent indicated sales revenue between $50 million and $1 billion. Thirty-five percent of those completing the survey have between four and 10 years of industry experience, while 62 percent indicated that they have the authority to approve and authorize purchases within their operations. Just less than 50 percent of respondents listed their job duties as other corporate management and administration, and 15 percent work in marketing and sales. Vice president of operations and warehousing/distribution/logistics both were represented by 9 percent of respondents, respectively. Seventy-four percent of respondents were male.
Looking for a reprint of this article?
From high-res PDFs to custom plaques, order your copy today!


