Beverage Industry logo
search
cart
facebook twitter linkedin youtube
  • Sign In
  • Create Account
  • Sign Out
  • My Account
Beverage Industry logo
  • NEWS
    • R&D News
    • Supplier News
  • PRODUCTS
    • New Products
    • Reader's Choice Poll
  • CATEGORIES
    • Alternative Drinks
    • Beer
    • Bottled Water
    • Cannabis Beverages
    • Carbonated Soft Drinks
    • Energy Drinks & Shots
    • Juice & Juice Drinks
    • Plant-Based Beverages
    • Sports Drinks
    • Tea and Coffee
    • Wine & Spirits
  • R&D
    • Beverage R&D Features
    • Ingredient Spotlight
  • PACKAGING
    • New Packages
    • Packaging Equipment
    • Packaging Material
  • OPERATIONS
    • Distribution
    • Plant Focus
  • TOP LISTS
    • Beer Market Report
    • Executive of the Year
    • State of the Beverage Industry
    • Top 100 Beverage Companies
    • Truck Report
    • Wholesaler of the Year
  • MEDIA
    • eBooks
    • Podcast
    • Polls
    • Videos
    • Webinars
  • DIRECTORIES
    • Annual Manual
    • Contract Packaging Guide
    • Take a Tour
  • MORE
    • Classifieds
    • Channel Strategies
    • Newsletters
    • Events
      • Membrane Technology Forum
    • Interactive Product Spotlights
    • Market Insights
    • Sponsor Insights
    • Store
    • White Papers
  • EMAG
    • eMagazine
    • Archived Issues
    • Advertise
  • SIGN UP!
Distribution

The 2017 State of the Beverage Fleet Industry

Beverage Industry releases results from annual fleet survey

By Tom Kelley
Own Lease Chart Fleet Study 2017
Source: BNP Media’s Market Research Division, Fleet Study 2017.
Top Maintenance Costs Chart Fleet Study 2017
Source: BNP Media’s Market Research Division, Fleet Study 2017.
Unplanned Downtime Repairs Chart Fleet Study 2017
Source: BNP Media’s Market Research Division, Fleet Study 2017.
Reducing Fuel Chart Fleet Study 2017
Source: BNP Media’s Market Research Division, Fleet Study 2017.
Operational Concerns Chart Fleet Study 2017
Source: BNP Media’s Market Research Division, Fleet Study 2017.
Own Lease Chart Fleet Study 2017
Top Maintenance Costs Chart Fleet Study 2017
Unplanned Downtime Repairs Chart Fleet Study 2017
Reducing Fuel Chart Fleet Study 2017
Operational Concerns Chart Fleet Study 2017
September 15, 2017

Beverage Industry conducted its fifth annual fleet survey earlier this year to get the latest data on the size and makeup of current delivery fleets, as well as operational concerns and strategies.

As with years past, the survey offers the publication an opportunity to see which operations are having the greatest impact on beverage fleets.
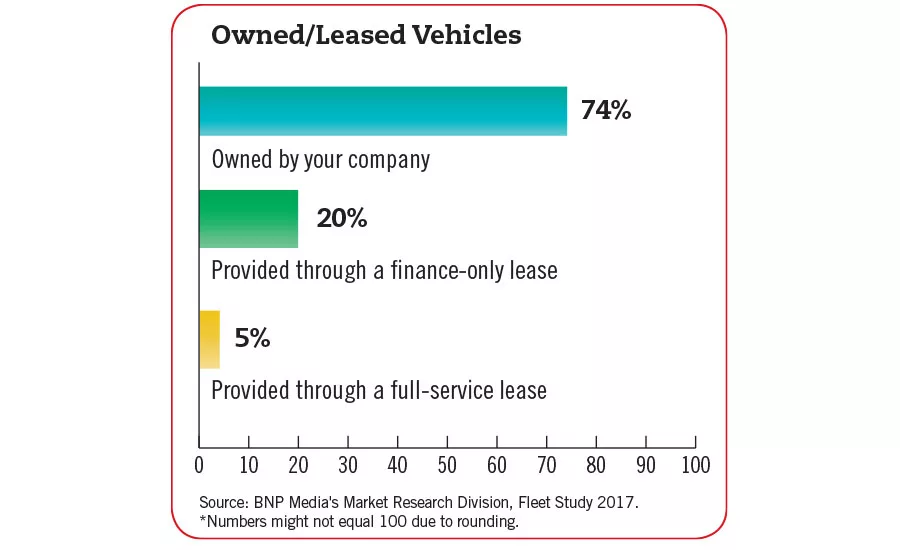
 

Vehicle Choices

The split between passenger vehicles (sedans, SUVs) and light trucks (pickups, small/large vans) has narrowed somewhat, though is still in favor of light trucks. The trends toward end-load equipment in favor of side-load equipment and tractor-trailers in favor of straight trucks continues, but has moderated somewhat in this year’s survey responses.

Compared with last year, survey respondents indicated a lower overall level of new vehicle purchases planned for the next 24 months, likely attributable to the shift toward retailers among the respondents. Of those who are planning new vehicle purchases, the majority still are replacing existing vehicles, but a growing number are expanding their fleets, demonstrating increased confidence in industry growth.


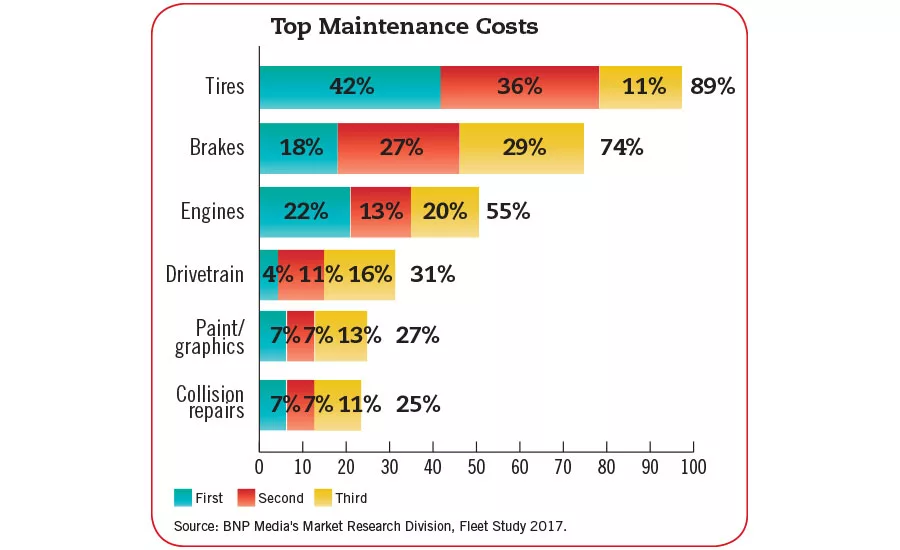
Maintenance & Downtime

Yet again, tires rank as the top maintenance cost for the majority of our respondents, while brakes remain in second place. In third place again this year, engine maintenance still is a top cost among more than half of the respondents.

While the relative rankings among the maintenance cost categories are unchanged from last year, drivetrain costs have significantly dropped, and collision costs have jumped.

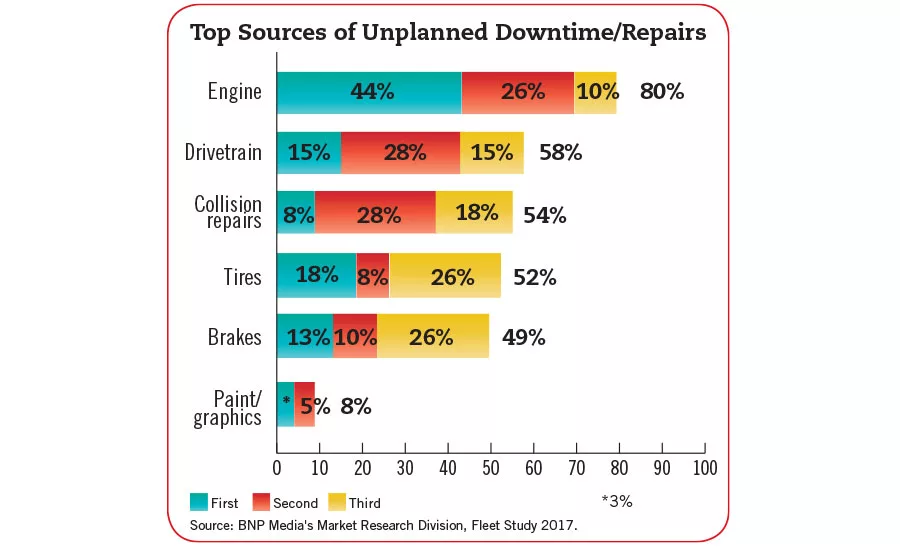
Although still ranking high on top of the list among causes of downtime/unplanned repairs, engine and drivetrain failures have dropped from last year on a percentage basis; while brakes and tires have jumped significantly higher.

Again this year, collision repairs continue to be ranked high by more than half of the respondents, though these repairs also should rank high on the unplanned repair scale, as most other types of repairs can be scheduled to avoid downtime when properly managed.


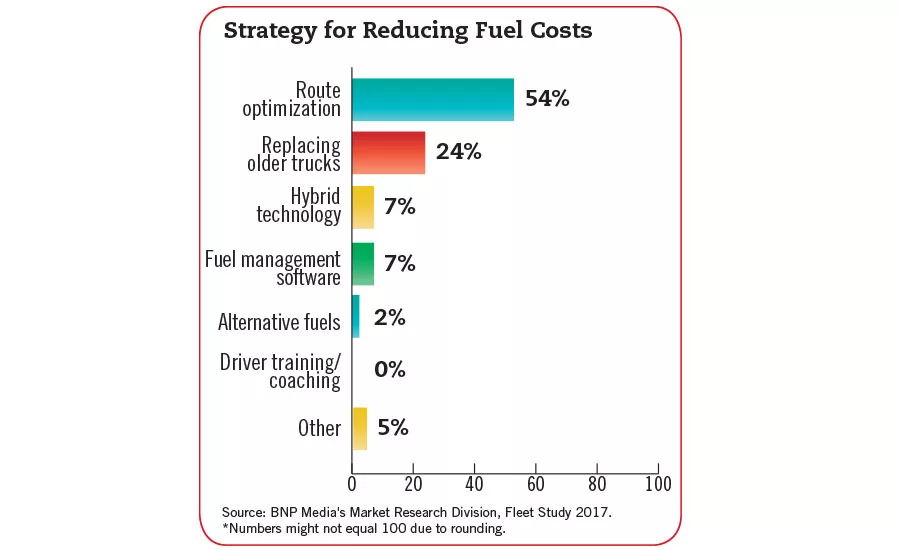
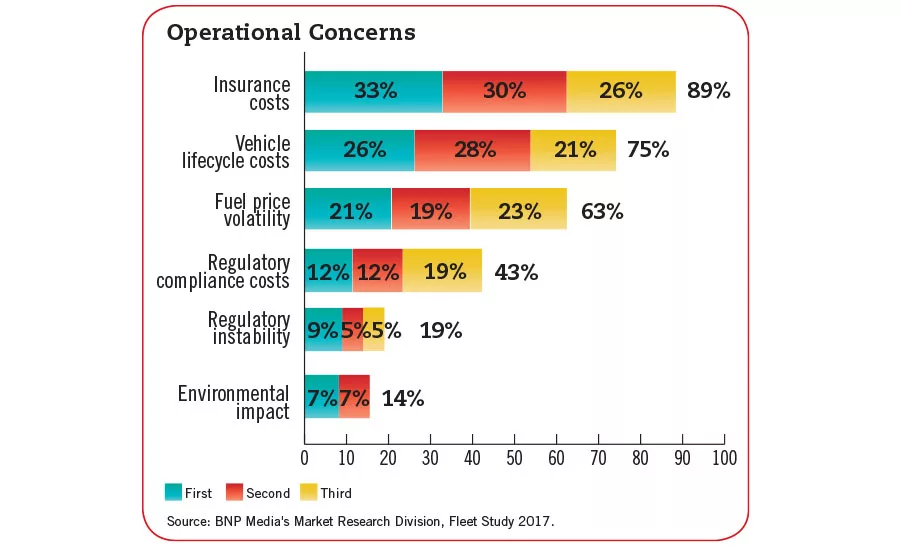
Operational Concerns & Fuel Cost Strategies

Although the relative ranking among top operational concerns are unchanged from last year, insurance cost, vehicle lifecycle cost and fuel price volatility have all increased in the percentage of respondents citing these areas as their largest concerns this year, while regulatory and environmental concerns have moderated.

Route optimization continues to be the most popular fuel cost reduction strategy among this year’s respondents, while replacing older trucks as a means of reducing fuel costs has moderated slightly since last year.

A bit of encouraging news comes in the form of driver training/coaching — one of the most cost-effective options — moving up the list of fuel cost reduction strategies by two spots. It’s critical to remember that a driver can impact fuel economy by as much as 30 percent, so training/coaching still deserves more consideration as a fuel saving strategy. BI


Beverage Industry’s Fleet Survey was conducted by BNP Media’s Market Research Division. The online survey was conducted between June 29 and July 13 and included a systematic random sample of the domestic circulation of Beverage Industry.

Geographically, the respondents were well distributed across the United States, with slightly stronger representation from the Southern region compared with the Midwest, West Coast and Northeastern regions. No U.S. territories were included in this survey. Thirty-eight percent of the respondents had industry involvement in the producer/bottler area, while 30 percent labeled themselves as a retailer. Twenty-eight percent of respondents indicated that they operated in the distributor/wholesaler industry, and the remaining 4 percent listed other for their industry involvement.

When it comes to company size, annual sales revenue between $500,001 and $1 million as well as $1 million and $10 million, each were represented by 19 percent of respondents, respectively. Seventeen percent indicated sales revenue of more than $5 billion. Thirty percent of those completing the survey have between 21 and 30 years of industry experience, while 66 percent indicated that they have the authority to approve and authorize purchases within their operations. Thirty-eight percent of respondents listed their job duties as other corporate management and administration, and 36 percent identified themselves as vice president of operations. Marketing and sales was represented by 8 percent while purchasing and warehousing/distribution/logistics both were represented by 6 percent of respondents, respectively. Eighty-six percent of respondents were male.

KEYWORDS: beverage fleet beverage fleet survey fleet maintenance trucks

Share This Story

Looking for a reprint of this article?
From high-res PDFs to custom plaques, order your copy today!

Recommended Content

JOIN TODAY
to unlock your recommendations.

Already have an account? Sign In

  • top 100 beverage companies

    Top 100 Beverage Companies of 2024

    For the global beverage market, mergers and acquisitions...
    Beverage News
  • Chocolate, Strawberry, Vanilla shakes

    Classic flavors provide reliable, consistent results for beverage-makers

    Classic flavors of chocolate, vanilla and strawberry...
    Ingredient Spotlight
    By: Chloe Alverson
  • Free Spirits Instant Bar Bundle

    Lifestyle trends drive growth for non-alcohol category

    As lifestyle trends continue to drive growth for the...
    Alternative Drinks
    By: Lauren Sabetta
Manage My Account
  • Newsletters
  • Online Registration
  • Subscription Customer Service
  • eMagazine Subscription
  • Manage My Preferences

More Videos

Sponsored Content

Sponsored Content is a special paid section where industry companies provide high quality, objective, non-commercial content around topics of interest to the Beverage Industry audience. All Sponsored Content is supplied by the advertising company and any opinions expressed in this article are those of the author and not necessarily reflect the views of Beverage Industry or its parent company, BNP Media. Interested in participating in our Sponsored Content section? Contact your local rep!

close
  • Woman in Coat
    Sponsored byApplied Food Sciences

    Opportunity for Hormone Support in Functional Beverages

Popular Stories

Pepsi Prebiotic Cola

Pepsi offers limited online release of Prebiotic Cola

Airheads Soda

AIRHEADS enter beverage market

Buffalo Trace Distillery

Buffalo Trace Distillery pays homage to its region’s heritage and history

making connections webinar

Events

April 16, 2025

2025 State of the Industry Series: Alcoholic Beverages

On Demand In Beverage Industry’s annual State of the Industry: The Alcohol Beverage Market, analysts at S&D Insights LLC delve into these trends and how they’re shaping the industry.

View All Submit An Event

Poll

Retail Coffee Segment

What retail coffee segments will fare well into the next year?
View Results Poll Archive

Products

Milk and Dairy Foods Nutrition, Processing and Healthy Aging

Milk and Dairy Foods Nutrition, Processing and Healthy Aging

See More Products

Related Articles

  • The 2014 State of the Beverage Fleet Industry

    See More
  • Owned/leased vehicles chart

    The 2016 State of the Beverage Fleet Industry

    See More
  • The 2015 State of the Beverage Fleet Industry

    See More

Related Directories

  • DMW&H

    DMW&H stands out as a premier provider of integrated material handling and automation solutions with a heritage dating back to 1964. Specializing in the design, implementation, and support of sophisticated warehouse and distribution systems across diverse industries, DMW&H has cultivated particular expertise in serving the Wine and Spirits sector for over 30 years. Their solutions encompass conveyor systems, sortation technologies, robotic automation, and comprehensive indaGO Warehouse Execution Systems (WES), all aimed at enhancing efficiency, productivity, and accuracy in logistics and distribution operations.
  • ORTEC

    For more than 40 years ORTEC has supported beverage manufacturers and distributors worldwide. Our Beverage Suite of Loading and Routing solutions allow our customers to continuously improve their business results by enabling them to predict, prepare, plan, execute, monitor, and improve their operation.
  • Magline Inc.

    Magline, Inc. is the world’s leading manufacturer of Magliner route distribution solutions and much more. We are a committed partner in helping to grow your business. By listening to your challenges first, our team can work with you to develop the right solutions that fit your unique distribution needs.
×

Elevate your expertise in the beverage marketplace with unparalleled insights and connections.

Join thousands of beverage professionals today. Shouldn’t you know what they know?

JOIN NOW!
  • RESOURCES
    • Advertise
    • Contact Us
    • Directories
    • Store
    • Want More
  • SIGN UP TODAY
    • Create Account
    • eMagazine
    • Newsletters
    • Customer Service
    • Manage Preferences
  • SERVICES
    • Marketing Services
    • Reprints
    • Market Research
    • List Rental
    • Survey/Respondent Access
  • STAY CONNECTED
    • LinkedIn
    • Facebook
    • YouTube
    • X (Twitter)
  • PRIVACY
    • PRIVACY POLICY
    • TERMS & CONDITIONS
    • DO NOT SELL MY PERSONAL INFORMATION
    • PRIVACY REQUEST
    • ACCESSIBILITY

Copyright ©2025. All Rights Reserved BNP Media.

Design, CMS, Hosting & Web Development :: ePublishing