2018 State of the Beverage Industry: Bottled water remains the No. 1 beverage in the United States
Beverage holds place for second consecutive year
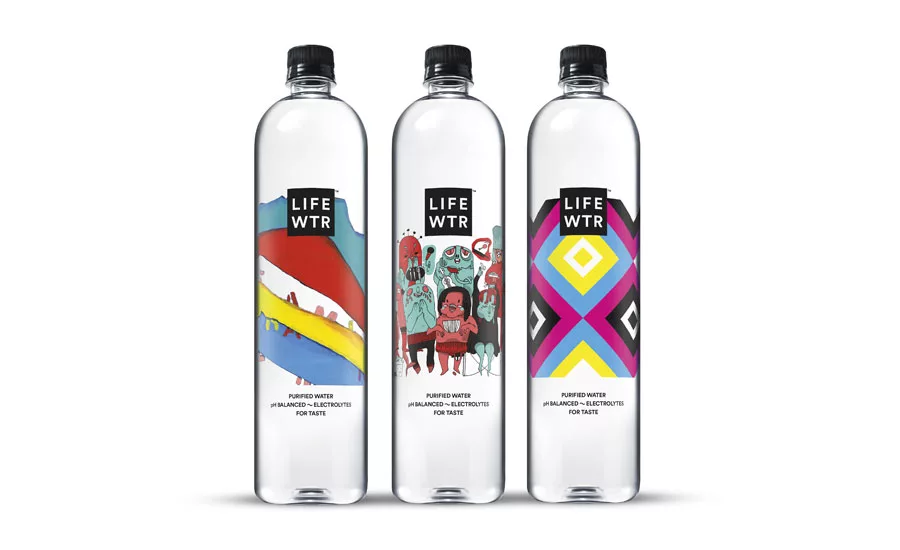
For the second consecutive year, The International Bottled Water Association (IBWA), Alexandria, Va., and New York-based Beverage Marketing Corporation (BMC) announced that bottled water is the No. 1 beverage in the United States, by volume.
In 2017, bottled water volume grew to 13.7 billion gallons, a 7 percent increase over the previous year, BMC said in statement. Bottled water sales now total $18.5 billion, an increase of 8.8 percent. Per capita consumption saw a 6.2 percent increase from last year, exceeding over 42 gallons of bottled water. BMC statistics show this is a result of the average annual intake of carbonated soft drinks (CSDs) falling to 37.5 gallons.
As CSD sales decreased for the thirteenth consecutive year, the distance between bottled water and CSDs keeps on widening, experts say. BMC predicts bottled water will reach 50 gallons per capita within a few years.
Within the bottled water category, BMC notes consistent growth for all the segments in 2017: domestic non-sparkling water increased 5.5 percent, domestic sparkling water increased 27.5 percent and imported water increased 9.2 percent.
“Bottled water’s rocket-like rise in popularity coincides with pronounced shifts in consumer preferences for refreshment and rehydration,” said Michael C. Bellas, BMC chairman and chief executive officer (CEO) in a statement. “As the quintessential portable and affordable beverage, bottled water introduces new usage and occasion habits. Suitable for consumption at any time of the day or night, and not necessarily in need of being kept ice cold, bottled water simply is the preferred beverage not only for consumers aiming to reduce caloric intake or lessen artificial sweetener usage but also for consumers of all kinds.”
(Individual brands)
| Dollar Sales | % CHANGE VS. PRIOR YEAR | MARKET SHARE | % CHANGE VS. PRIOR YEAR | |
| Private label | $2,684,562,176 | 6.4 | 22.6 | 0.7 |
| Dasani | $1,081,352,832 | -2.5 | 9.1 | -0.5 |
| Aquafina | $1,066,444,608 | -2.9 | 9 | -0.6 |
| Nestlé Pure Life | $868,201,920 | -6.5 | 7.3 | -0.8 |
| Glacéau Smart Water | $842,916,672 | -4 | 7 | -0.5 |
| Category total* | $11,873,474,560 | 3.3 | 100.0 | — |
Source: Information Resources Inc. (IRI), Chicago. Total U.S. supermarkets, drug stores, gas and convenience stores, mass merchandisers, military commissaries, and select club and dollar retail chains for the 52 weeks ending May 20.
Chicago-based Information Resources Inc. (IRI) data also points to this fact. According to IRI, the dollar sales for overall bottled water category were $16 billion for the 52 weeks ending May 20 in total U.S. multi-outlets and convenience stores. Convenience / PET still bottled water accounted for $11.8 billion, while jug / bulk still bottled water accounted for $1.5 billion and seltzer / sparkling / mineral bottled water accounted for $2.6 billion during that same timeframe.
Convenience / PET and jug/bulk increased 3.3 percent and 3.9 percent, respectively, while seltzer / sparkling / mineral waters experienced 13.5 percent growth in U.S. multi-outlets and convenience stores for the 52 weeks ending May 20, IRI data states.
(Individual brands)
| Dollar Sales | % CHANGE VS. PRIOR YEAR | MARKET SHARE | % CHANGE VS. PRIOR YEAR | |
| Private label | $682,056,064 | 5.8 | 44.9 | 0.8 |
| Poland Springs | $146,672,352 | 2.7 | 9.6 | -0.1 |
| Crystal Geyser | $104,401,592 | 9.5 | 6.9 | 0.4 |
| Deer Park | $63,774,632 | -2.8 | 4.2 | -0.3 |
| Arrowhead | $60,278,764 | -5.8 | 4 | -0.4 |
| Category total* | $1,518,619,136 | 3.9 | 100.0 | — |
Source: Information Resources Inc. (IRI), Chicago. Total U.S. supermarkets, drug stores, gas and convenience stores, mass merchandisers, military commissaries, and select club and dollar retail chains for the 52 weeks ending May 20.
“The key winner is domestic sparkling, which continues to accelerate,” said Bellas in Beverage Industry’s October 2017 issue. “We’ve got that up about almost 40 percent [by volume] in the first half [of 2017].”
In that same issue, Jordan Rost, vice president of Consumer Insights at New York-based Nielsen, added: “Sparkling water is performing incredibly well… As soft drink sales contract, we see consumers filling their cravings for carbonation in the water category. Competition may be close to home as sparkling water exceeds the growth of flat and distilled water.”
(Individual brands)
| Dollar Sales | % CHANGE VS. PRIOR YEAR | MARKET SHARE | % CHANGE VS. PRIOR YEAR | |
| Private label | $517,730,048 | 9.7 | 19.5 | -0.7 |
| La Croix | $414,014,432 | 43 | 15.6 | 3.2 |
| Sparkling Ice | $392,283,136 | 3.9 | 14.8 | -1.4 |
| Perrier | $276,357,152 | 12.4 | 10.4 | -0.1 |
| Polar | $155,634,976 | 23 | 5.9 | 0.5 |
| Category total* | $2,648,487,424 | 13.5 | 100.0 | — |
Source: Information Resources Inc. (IRI), Chicago. Total U.S. supermarkets, drug stores, gas and convenience stores, mass merchandisers, military commissaries, and select club and dollar retail chains for the 52 weeks ending May 20.
Bellas predicts that sparkling water will continue to have accelerated growth. “Sparkling waters are going to be growing at double-digits for a long time — for quarters ahead,” he says.
Industry experts echo similar sentiments about the popularity of water. Joe Doss, IBWA president and CEO, notes that a large part of the sales growth for bottled water is a result of a “consumer shift” from sugar-sweetened beverages to bottled water.
BMC data is consistent with a Harris Poll conducted for IBWA which found that more than 3 in 5 Americans (63 percent) say bottled water (still and/or sparkling) is among their most preferred beverages, whereas CSDs are at 58 percent. Nearly all Americans (94 percent) believe that bottled water is a healthier choice than soft drinks, and 93 percent say bottled water should be available wherever drinks are sold.
In the future, Bellas expects that bottled water will continue its updward trajectory and set new milestones in the beverage marketplace. BI
Looking for a reprint of this article?
From high-res PDFs to custom plaques, order your copy today!

