2022 State of the Beverage Industry | Premium, health and wellness lifting wine, spirits categories
Low alcohol wines, tequila resonating with consumers
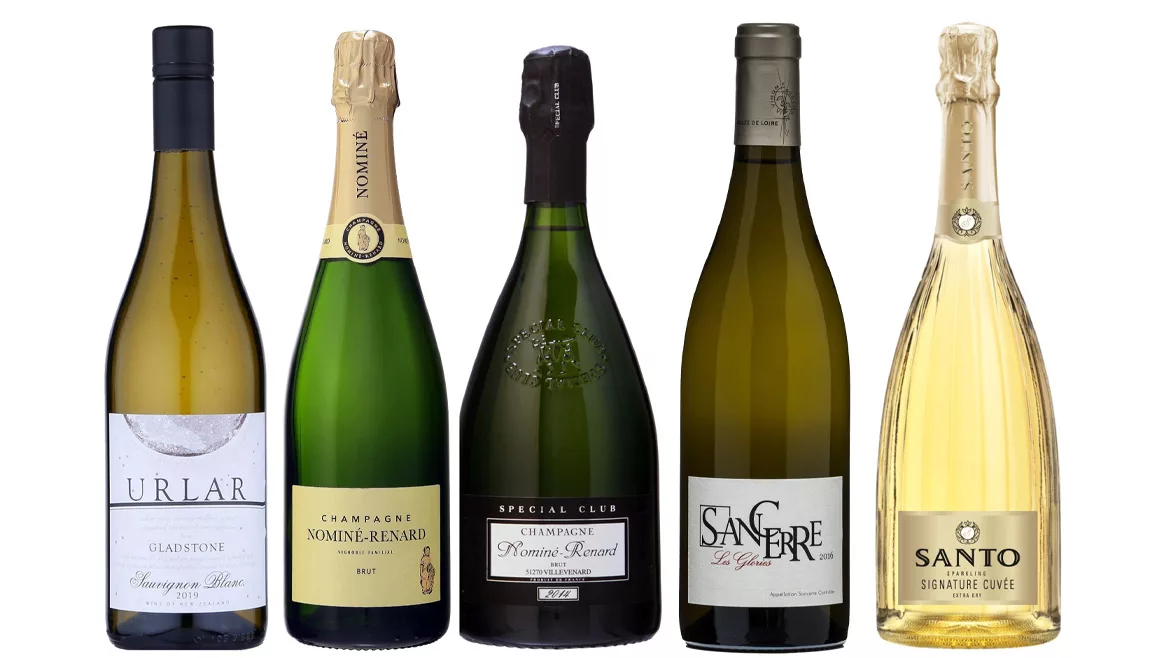
For the U.S. wine category, rebounding has been nuanced as it looks to rebound from 2020 dollar sales losses, while keeping the category relevant and exciting through emerging styles, formats and usage, experts note.
Mintel’s “U.S. Wine Market Report 2021” notes that, despite on-premise closures that shook the wine market in 2020, circumstances surrounding the COVID-19 pandemic allowed the category to further solidify its place in at-home casual and relaxing occasions, which helped close the gap between wine and beer purchases for off-premise consumption.
“While some U.S. wine trends established during this time will endure in the near term, as consumers’ grapple with fluctuating and varying stages of re-emergence readiness, continued improvements in COVID-19 case rates and comfort with venturing away from home will continue to benefit wine, as consumers are eager to raise a glass to a return to normalcy,” it states.
Yet, as the quest for health represents the strongest challenge to the wine category, 26% of U.S. alcohol drinkers aged 22-plus report reducing consumption in 2021, according to the report.
“The leading reason for cutting back is in effort to improve health. Further, three in 10 retail alcohol shoppers aged 22-plus say drinking less alcohol is the fastest way to improve their health,” it continues. “The acceleration of low-alcohol and alcohol-free wine purchase and interest, as well as wine offerings that create permissibility through ‘less-but-better,’ natural ingredients and a clean label have a strong chance to vie for those who are limiting consumption occasions.”
|
|
DOLLAR SALES | % CHANGE vs PRIOR YEAR | CASE SALES | % CHANGE vs PRIOR YEAR | |
| 1 | Barefoot | $582,349,292 | -13.2
|
8,495,207 | -15.5 |
| 2 | Sutter Home | $405,136,424 | -4.9
|
5,554,391 | -6.8 |
| 3 | Josh Cellars | $386,927,755 | 8.9 | 2,521,424 | 7.2 |
| 4 | Franzia Box | $358,985,877 | -8.7 | 12,117,626 | -10.5 |
| 5 | Woodbridge by Robert Mondavi | $132,474,592 | -10.6 | 4,896,748 | -10.2 |
|
|
Category Total* | $1,407,566,627 | -6.8 | 126,488,922 | -10.4 |
*Includes brands not listed
Source: Information Resources, Inc. (IRI), Chicago. Total U.S. supermarkets, drug stores, gas and convenience stores, mass merchandisers, military commissaries, and select club and dollar retail chains for the 52 weeks ending May 15.
However, as non-alcohol wines still account for only about 4% of overall wine sales, they are having a minimal impact on overall wine trends, explained Mike Wyatt, consultant at Chicago-based Information Resources Inc. (IRI) in Beverage Industry’s February eMagazine.
In New York-based Beverage Marketing Corporation’s (BMC) report “Beverages 2022: What’s In Store?,” the market research firm projects that 2021 volume sales for wine was up 1.9%. According to Chicago-based Information Resources Inc. (IRI), however, table wine sales were down 6.8% totaling $11.8 billion for the 52 weeks ending May 15 in total U.S. multi-outlets. Case sales were down 10.4%. Sparkling wine/Champagne sales have fared slightly better. IRI data shows dollar sales are down 1.9%, totaling $1.7 billion, with case sales down 4.9%.
The wine category also has seen premium offerings drive sales, experts noted. “Convenience, premiumization and approachability are trends that have had a positive impact on the wine category,” Wyatt said in Beverage Industry’s February eMagazine. “These trends are best evidenced by canned and boxed wine growth outpacing traditional packaging, $20 plus per bottle sales growth outpacing lower price points, and sweeter wines outpacing traditional and bolder flavored wines.”
Meanwhile, as many consumers overall are shifting their preferences toward a healthy lifestyle, the use of natural and chemical-free products has increased, leading to a surge in demand for organic wines, according to a September 2020 report by New York-based The Insight Partners.
“This trend has led to a surge in demand for organic wine” it states. “Organic wine is produced and processed under specific standards, which prohibit the use of synthetic fertilizers, pesticides and several other synthetic additives.”

Meanwhile the spirits market is seeing premiumization as a driving force for the category’s growth. Supplier sales rose 12% in 2021 to a total of $35.8 billion, while volumes rose 9.3% to 291.1 million 9-liter cases, according to the Washington, D.C.-based Distilled Spirits Council of the United States (DISCUS).
At the Distilled Spirits Council Annual Economic Briefing on Feb. 3, DISCUS President and CEO Chris Swonger reported that spirits gained market share of the total U.S. beverage alcohol market in 2021, with sales rising 1.7 share points to 41.3%. Spirits growth was supported by hospitality industry recovery, but more help still is needed for restaurants and bars, he noted.
“Last year, enthusiasm for spirits continued as consumers spent more to elevate their cocktail experiences with super-premium brands,” Swonger said in a statement. “Consumers savoring spirits at home and trading up to higher-end brands, combined with the gradual reopening of bars and restaurants, resulted in record sales for the spirits sector. We’re also seeing strong growth for spirits-based ready-to-drink products, and that’s adding to our sector’s gains as well.”
In BMC’s report “Beverages 2022: What’s In Store?,” the market research firm projects that 2021 volume sales for spirits was up 5.4%. According to sales data from IRI, the overall spirits category saw sales relatively flat for the 52 weeks ending May 15 in total U.S. multi-outlets with it nearly reaching $10.6 billion. Case sales for that time were up 0.7%.
|
|
DOLLAR SALES | % CHANGE vs PRIOR YEAR | CASE SALES | % CHANGE vs PRIOR YEAR | |
| 1 | Whiskey | $3,627,055,844 | -0.9 | 16,603,755 | -3.5 |
| 2 | Vodka | $2,342,057,029 | -6 | 18,048,184 | -7.5 |
| 3 | Tequila | $1,035,750,598 | 7.1 | 3,537,219 | 0.9 |
| 4 | Premixed cocktails | $917,788,569 | 32.3 | 10,961,566 | 26.2 |
| 5 | Rum | $685,462,271 | -8.6 | 5,159,179 | -8.9 |
| 6 | Cordials | $672,776,265 | -5.7 | 3,110,468 | -7.2 |
| 7 | Brandy/cognac | $484,293,411 | -11.4 | 1,720,534 | -14.1 |
| 8 | Non-alcoholic mixers | $358,286,327 | -8.1 | 7,785,285 | -9.8 |
| 9 | Gin | $240,295,017 | -9.7 | 1,407,411 |
-12 |
| 10 | Spirits seltzer centric | $234,745,030 | 131.8 | 4,085,297 |
134.10 |
|
|
Market Total* | $10,598,510,360 | 0.2 | 72,418,898 | 0.7 |
*Includes brands not listed
Source: Information Resources, Inc. (IRI), Chicago. Total U.S. supermarkets, drug stores, gas and convenience stores, mass merchandisers, military commissaries, and select club and dollar retail chains for the 52 weeks ending May 15.
Of the segments, spirits seltzer centric experienced the most growth (dollar sales up 131.8%). Albeit the emerging category still only totaled $234.7 million in sales. Of the more established categories, premixed cocktails and tequila showed they still are popular with consumers, as premixed cocktail sales were up 32.3%, totaling $917.7 million, while tequila was up 7.1%, totaling more than $1 billion.
Based on data from market research firms, experts note that tequila soon could overtake vodka as America’s favorite liquor, fueled by consumers’ desire for pricey bottles of agave-based spirits. In fact, agave-based spirits saw sales climb 30.1% compared with the prior year to $5.2 billion, according to DISCUS.
“Agave-based spirits are in fact growing very fast,” BMC’s Sudano said in Beverage Industry’s April eMagazine. “On a volume basis, over 20% while even greater on a dollar basis. Not all agave spirits are tequila or mezcal. Agave concentrate can be added to any spirit including whiskey. Agave (tequila) is the fastest growing traditional spirit type. However, RTDs still outpace agave beverages.”
Noting tequila’s double-digit 12.4% growth, Kaleigh Theriault, manager for beverage alcohol thought leadership at NielsenIQ, Chicago, noted that within tequila, many types are resonating in the market.
“The following segments outshone traditional white/silver and gold/especial offerings — añejo extra, joven, añejo, mezcal and resposado,” she explained in Beverage Industry’s April eMagazine. “For whiskeys, Japanese whiskies are driving strong growth rates, but on a smaller base, while American whiskey and Scotch are also seeing growth.”
Looking for a reprint of this article?
From high-res PDFs to custom plaques, order your copy today!


