2017 State of the Beverage Industry: Import beers benefit from price point, premiumization
Beer volume down slightly in 2016

Although market reports suggest that the U.S. beer market has stabilized following years of modest declines, the segments that have helped the category suggest that consumer preferences have shifted when purchasing brewed beverages.
“The beer market has stabilized over the past couple of years after declining between 1 and 2 percent in 2009-2011 and then again in 2013,” said Brian Sudano, managing partner with Beverage Marketing Corporation (BMC), New York, in Beverage Industry’s March issue. “However, the slowdown of craft and [flavored malt beverages] (FMBs) in the second half of 2016 has put pressure on the category as seen by the 2 percent drop in third quarter depletions and 6 percent drop in beer shipments in October.”
In BMC’s February presentation “Beverages 2017 What’s in Store?,” the market research firm reported that volume sales for the beer category were down 0.2 percent. Additionally, the presentation noted that beer’s volume share of stomach was 10.3 percent in 2016, a slight decrease from 10.6 percent in 2011.
On a dollar sales basis, the U.S. beer market did show a slight uptick. The category was up 1.8 percent, totaling more than $34.3 billion in sales, according to Information Resources Inc. (IRI), for the 52 weeks ending May 14 in total U.S. multi-outlets and convenience stores. The Chicago-based market research firm’s data also showed that case sales were flat for the time period.
Although domestic beer sales account for the lion’s share of the U.S. beer market, premium and sub-premium brands have underperformed, while the super-premium sub-segment has been a boon for domestic beer by aligning with consumer trends.
“Premiumization continues to impact the domestic beer segment, with the above-premium segments driving most of the domestic beer growth, particularly super premium, flavored malt beverages and some areas of craft beer,” said Danelle Kosmal, vice president of beverage alcohol practice for New York-based Nielsen, in Beverage Industry’s March issue. “Among the different consumer segments and generations, millennial consumers are driving much of this high-end growth.”
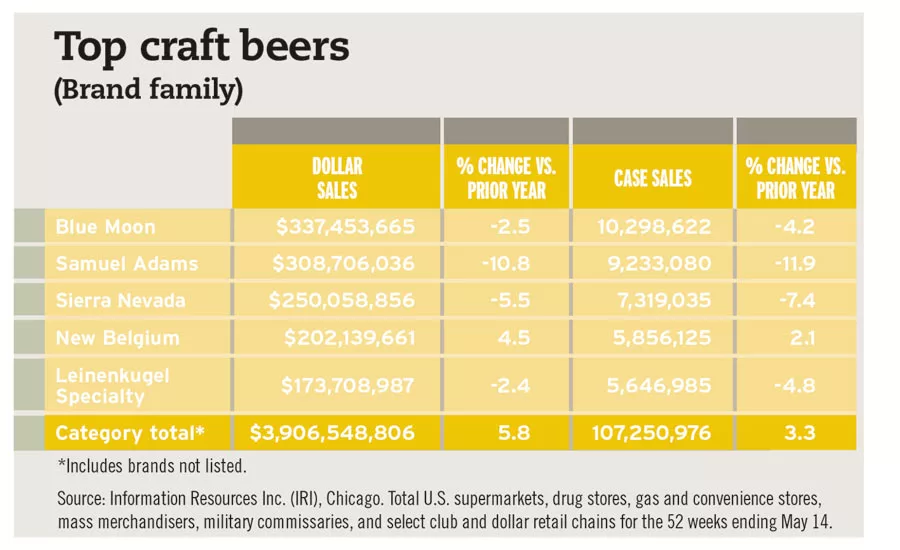
Also tapping into the premiumization trends has been the craft beer segment. In the United States, craft beer represented 12.3 percent of the volume share in 2016, according to The Brewers Association, Boulder, Colo. This is up from its 5.7 percent share in 2011.
Although craft beer has increased its share within the beer market, the segment is experiencing a deceleration in dollar sales. According to IRI data, dollars were up 5.8 percent for the 52 weeks ending May 14. Comparatively, sales were up 13.1 percent for the 52 weeks ending May 15, 2016.
“Consumer fatigue and confusion have begun to take hold in the category,” BMC's Sudano said in Beverage Industry’s March issue. “There have been too many brands entering the marketplace in too short of a period of time, which has resulted in some quality issues also. As the craft market has slowed, retailers have taken a look at [their] craft offerings as turn for square foot resulting in SKUs being eliminated. This further will put pressure on craft velocity.”
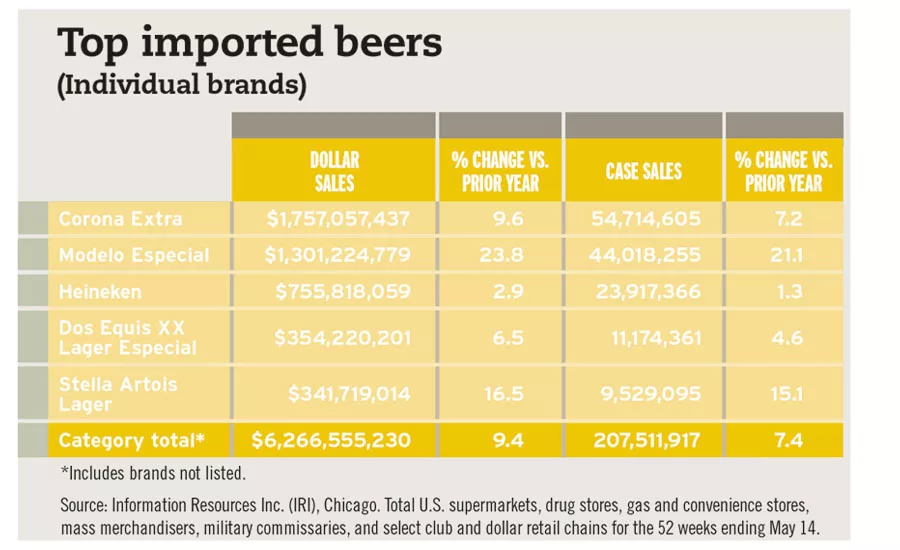
Yet, craft beer is not the only segment that is helping to offset the declines of the domestic beer market. Import beers continue grow as they appeal to premiumization trends and much more.
“Imports fall into an interesting price point, where they benefit from the ongoing premiumization trend, but typically are priced slightly lower than a craft beer,” Kosmal said in Beverage Industry’s March issue. “It’s an interesting competitive space for them.”
According to IRI data, the imported beer segment is up more than 9 percent in dollars and more than 7 percent in case sales for the 52 weeks ending May 14.
Among the various locales, Mexican beers performed the best in 2016. In Nielsen-measured off-premise channels for the 52 weeks ending Dec. 31, 2016, Mexican imports were up nearly 11 percent in volume and slightly less than 14 percent in dollar sales. BI
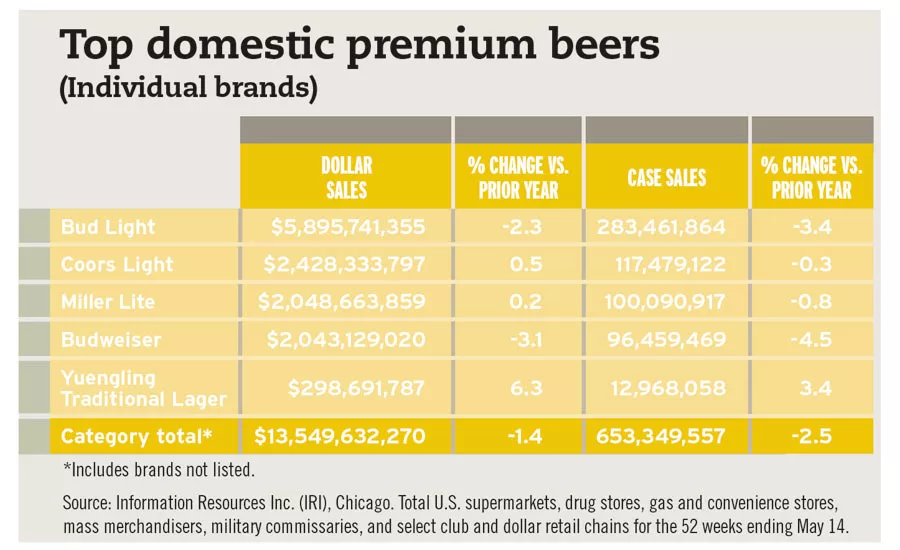
Top domestic premium beers
(Individual brands)
| Bud Light | $5,895,741,355 | -2.3 | 283,461,864 | -3.4 |
| Coors Light | $2,428,333,797 | 0.5 | 117,479,122 | -0.3 |
| Miller Lite | $2,048,663,859 | 0.2 | 100,090,917 | -0.8 |
| Budweiser | $2,043,129,020 | -3.1 | 96,459,469 | -4.5 |
| Yuengling Traditional Lager | $298,691,787 | 6.3 | 12,968,058 | 3.4 |
| Category Total* | $13,549,632,270 | -1.4 | 653,349,557 | -2.5 |
*Includes brands not listed.
Source: Information Resources Inc. (IRI), Chicago. Total U.S. supermarkets, drug stores, gas and convenience stores, mass merchandisers, military commissaries, and select club and dollar retail chains for the 52 weeks ending May 14.
Top imported beers
(Individual brands)
| Corona Extra | $1,757,057,437 | 9.6 | 54,714,605 | 7.2 |
| Modelo Especial | $1,301,224,779 | 23.8 | 44,018,255 | 21.1 |
| Heineken | $755,818,059 | 2.9 | 23,917,366 | 1.3 |
| Dos Equis XX Lager Especial | $354,220,201 | 6.5 | 11,174,361 | 4.6 |
| Stella Artois Lager | $341,719,014 | 16.5 | 9,529,095 | 15.1 |
| Category Total* | $6,266,555,230 | 9.4 | 207,511,917 | 7.4 |
*Includes brands not listed.
Source: Information Resources Inc. (IRI), Chicago. Total U.S. supermarkets, drug stores, gas and convenience stores, mass merchandisers, military commissaries, and select club and dollar retail chains for the 52 weeks ending May 14.
Top craft beers
(Individual brands)
| Blue Moon | $337,453,665 | -2.5 | 10,298,622 | -4.2 |
| Samuel Adams | $308,706,036 | -10.8 | 9,233,080 | -11.9 |
| Sierra Nevada | $250,058,856 | -5.5 | 7,319,035 | -7.4 |
| New Belgium | $202,139,661 | 4.5 | 5,856,125 | 2.1 |
| Leinenkugel Specialty | $173,708,987 | -2.4 | 5,646,985 | -4.8 |
| Category Total* | $3,906,548,806 | 5.8 | 107,250,976 | 3.3 |
*Includes brands not listed.
Source: Information Resources Inc. (IRI), Chicago. Total U.S. supermarkets, drug stores, gas and convenience stores, mass merchandisers, military commissaries, and select club and dollar retail chains for the 52 weeks ending May 14.
Looking for a reprint of this article?
From high-res PDFs to custom plaques, order your copy today!


