
Development plans
When it comes to new product development plans for beverages, the alcohol sector once again is the one to which companies are most likely to dedicate their resources.
Fifty-three percent of respondents selected the wine, beer and spirits category as an area of new product development. This is up from last year’s survey in which 44 percent named the category as an area of new product development.
For this year’s survey, sports/energy drinks came in at No. 2 with 33 percent. The list rounded out with water, juice (30 percent); coffee, tea (23 percent); carbonated soft drinks (20 percent); and dairy-based drinks/alternatives (20 percent).
In comparison, coffee, tea, water and juice tied for No. 2 in 2016 with 33 percent, respectively, naming these categories. Sports/energy drinks came next with 32 percent last year. Similar to this year’s survey, carbonated soft drinks (26 percent) and dairy-based drinks/alternatives (25 percent) rounded out the list.
When searching for new product idea generation, beverage-makers are turning to a variety of sources. When asked to select all that apply, 62 percent of respondents stated that customers/customer demand was an idea creator. This was followed by consumer trends with 60 percent of survey-takers naming this source.
Other popular idea generators in this year’s survey were in-house through teams and meetings (52 percent), marketing and sales (52 percent), and consumer research/testing (48 percent).
A natural cue
As indicated by its position as the No. 1 product attribute, natural continues to have a significant impact on new product development.
In 2018, an average of 87 percent of respondents plan to use natural flavors in beverage product development, while two in five respondents indicate that this will be an increase compared with previous years. In an open-ended question regarding the reason for the increase, motivators included healthy related, market related and consumer demand.
The average percentage of respondents utilizing natural flavors in 2018 was identical to the percentage that was listed for 2017 (87 percent); however, last year’s survey showed that slightly more than half indicated that their natural flavor usage was an increase from previous years.
When it comes to natural colors usage for 2018, an average of 83 percent of survey-takers noted their plans to use these solutions in beverage development. Of those noting their usage, 33 percent indicated that this will be an increase from previous years.
These numbers differ slightly compared with last year’s survey. According to the previous survey, an average of 85 percent of respondents indicated that they were going to use natural colors in 2017 for beverage development. Among those, 39 percent noted that it was an increase compared with previous years.
The process
When developing new products, the size of the company and employees working on these development plans can vary greatly.
Because of the diverse sizes of the respondent companies, the mean number of employees was 687, much larger than the 223 recorded in last year’s survey. This likely is due to responses from larger corporations. However, the median employees recorded in this year’s survey is 52, only two more than last year’s survey.
In regards to the number of employees who work on the development of new products, this year’s survey showed a mean of nine employees with a median of five. In comparison to last year’s survey, the mean was 14 while the median was five.
When it comes to keeping things in-house or outsourcing, in-house remains the popular choice, as three-quarters are not planning to outsource the new product development process. The remaining quarter that do plan to outsource indicated a variety of reasons with prototype development being the most noted. However, because of the small sample size of those that plan to outsource, results should be interpreted with caution in regards to the areas offered.
Just as the saying of “there is no ‘I’ in team,” many survey-takers embody this concept as nine in 10 respondents indicate this style when developing new products. Respondents were instructed to select all departments that apply when asked which ones are involved in the new product development process.
The top department noted was sales/marketing with 77 percent indicating it as such. This is a 4 percentage point increase compared with last year’s survey in which sales/marketing also was No. 1.
Other top departments listed by this year’s respondents were upper management (68 percent), R&D (58 percent), production (51 percent) and customers (42 percent). All of these departments were in last year’s Top 5 with some variations. For instance, production was No. 3 last year, with 46 percent listing it, while R&D was No. 4, with 44 percent naming the department.
For those who noted participation from upper management, involvement from the chief executive officer also remains popular for respondents, as 81 percent noted involvement from the top company executive. This is down from last year’s survey in which 88 percent noted the chief executive officer’s involvement.
Involvement from suppliers showed a slight edge to those not utilizing their participation. Fifty-eight percent of survey-takers stated that they do not involve suppliers in the new product development process. Of the 42 percent that do, the most noted role was to provide raw materials/ingredients. However, because of the small sample size, this should be interpreted with caution.
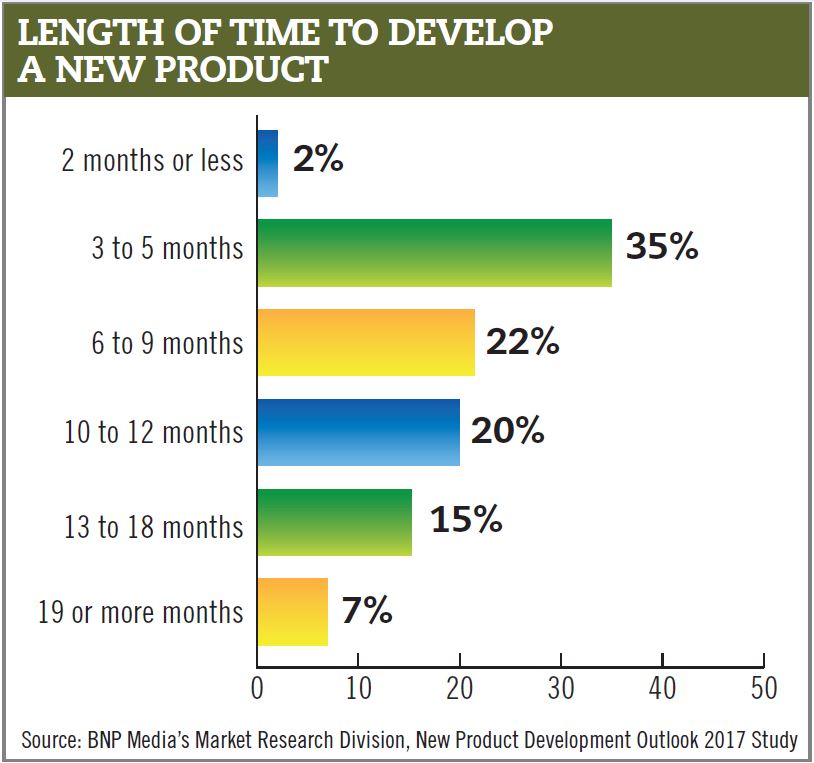
When it comes to the development timeframe, it takes respondents an average of nine months to develop a product from inception to launch. The majority (67 percent) noted this was about the same as previous development efforts while just more than a quarter (27 percent) indicated that this was faster.
In comparison to last year’s survey, the average timeframe was seven months, which one-third (33 percent) of respondents stated was faster than previous years.
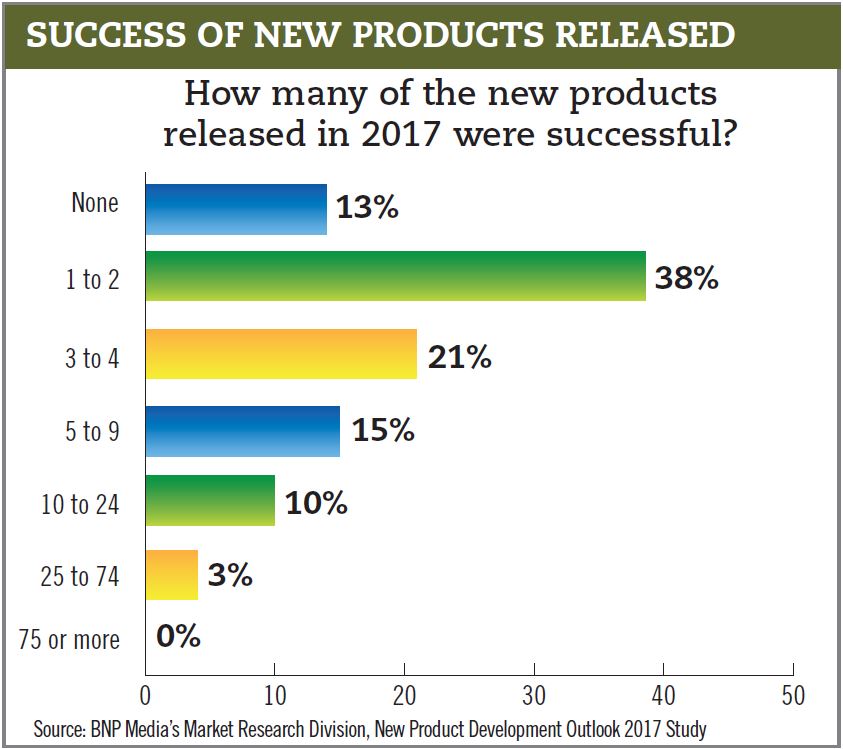
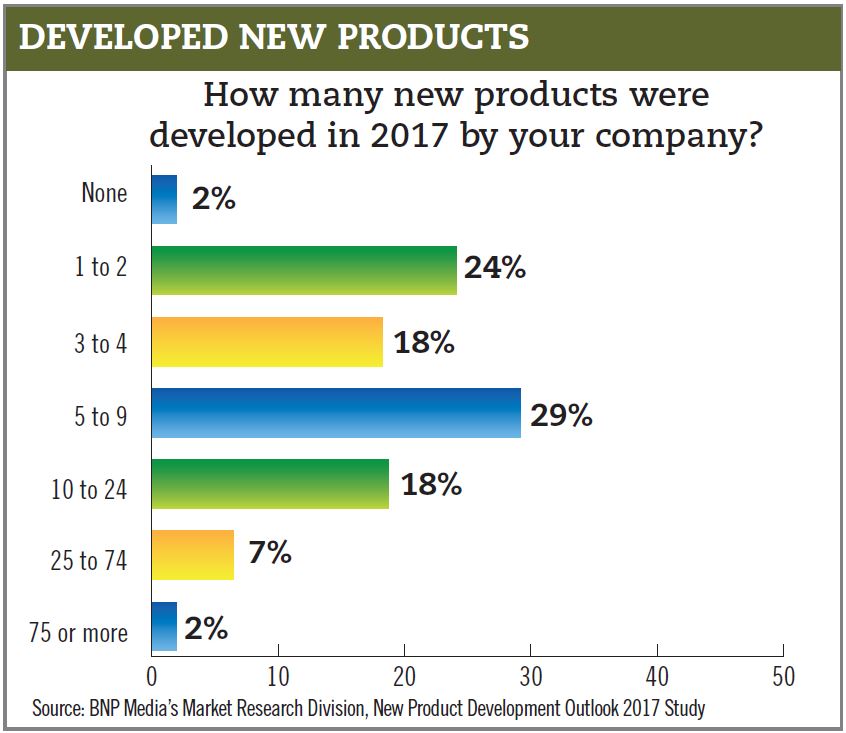
For 2017, survey-takers indicated that an average of nine products were developed, seven were released and, of those, five were successful. This compares with 2016 when an average of 11 were developed, eight were released and, of those, five were successful.
Going into 2018, 55 percent of respondents indicate that they plan to release more new products into the market compared with 2017. This is slightly above last year’s survey results in which 53 percent noted plans to increase their new product launches for 2017. BI
Beverage Industry’s New Product Development survey was conducted by BNP Media’s Market Research Division. The online survey was conducted between Oct. 23 and Nov. 6, 2017, and included a systematic random sample of the domestic circulation of Beverage Industry.
Of the respondents, 25 percent process wine/liquor, 17 percent process beer, 15 percent process soft drinks, 8 percent process alternative beverages/sports drinks, 8 percent process dairy-based drinks, 7 percent process bottled water, 5 percent process coffee and tea, 3 percent process juice and fruit drinks, 7 percent are beverage distributors, 3 percent are retailers, and 2 percent listed other as their primary product and service.
Twenty-nine percent of respondents were from companies with annual revenue of $100 million or more. Another 12 percent of respondents were from companies with revenue of less than $50,000. Twelve percent were from companies of annual revenue of $5 million to $9.9 million. A total of 10 percent were from companies in the revenue range of $500,000 to $999,999. Another 10 percent were from companies with annual revenue of $1 million to $1.9 million. Five percent were from companies with annual revenue of $100,000 to $249,999. Another 5 percent were from companies with annual revenue of $250,000 to $499,999. Another 5 percent were from companies with annual revenue of $2 million to $4.9 million. The annual company revenue ranges of $50,000 to $99,999; $15 million to $19.9 million; $20 million to $24.9 million; $25 million to $29.9 million; and $50 million to $99.9 million each were represented by 2 percent of respondents, respectively.
Males accounted for 83 percent of the respondents, and the average age equated to 48. For industry experience, 10 percent indicated one to three years; 25 percent reported four to 10 years; 25 percent said 11-20 years; 15 percent listed 21-30 years; 15 percent had 31-40 years of experience; 5 percent indicated 41-50 years of experience; and 3 percent noted more than 50 years of experience.
Regionally, 30 percent said they currently live in the West, 28 percent indicated the South, 23 percent listed the Midwest and 17 percent reported living in the Northeastern portion of the United States. Two percent listed U.S. territories.
Please visit clearmarkettrends.com to purchase and download the entire report as well as access a wide inventory of other studies done in this industry. You also can send an email to info@clearmarkettrends.com if you have any questions.


