
With award season in full swing, professionals and consumers are speculating about which movies, actors and actresses, musicians, and others from the arts and entertainment industries will come out on top. Although prognosticators are basing their winner choices from pools of five to 10 nominees, predicting which trends will impact consumer packaged goods (CPG) can be harder because of the myriad factors affecting the market.
Beverage manufacturers and their research and development (R&D) teams constantly are keeping an eye on what trends are fueling consumers’ beverage purchases in order to develop the next generation of products that will fulfill refreshment as well as functional need states. In Beverage Industry’s New Product Development Outlook 2017 Study, respondents indicated which trends they think will be the most popular in 2018.
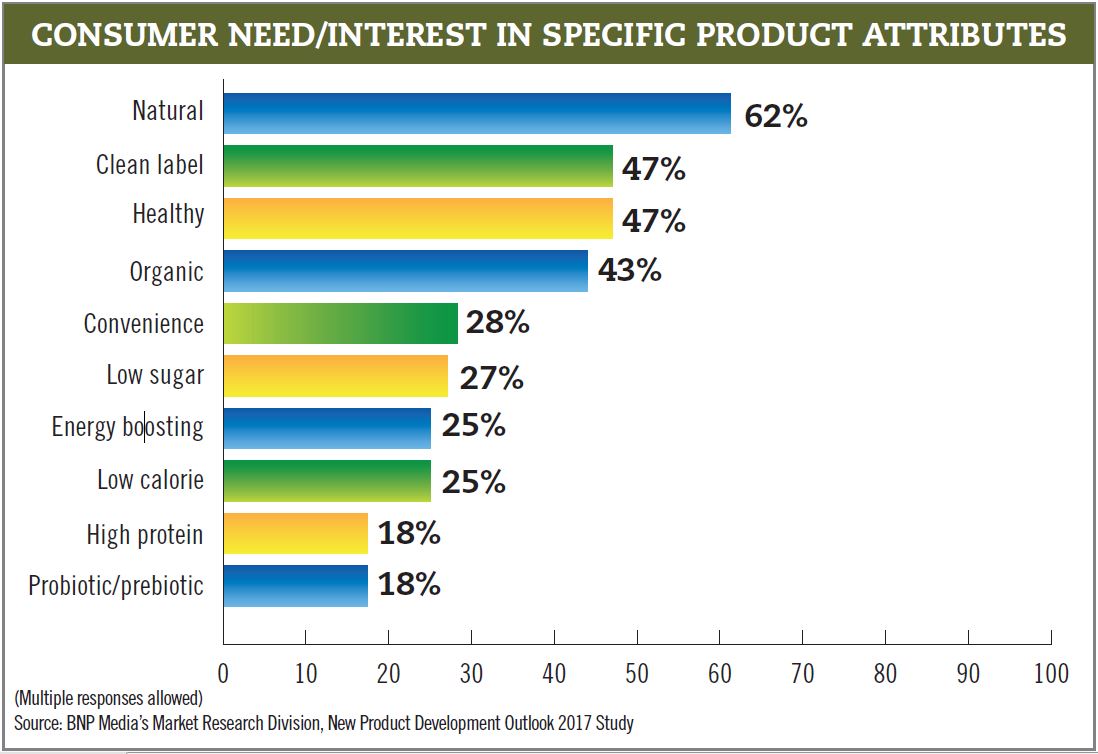
According to survey-takers, “natural” once again was perceived to be the latest consumer trend with 62 percent naming the product attribute. This is 10 percentage points lower than last year’s survey, but still was dominant to the other product attributes.
Tied for No. 2 were “clean label,” a newly added attribute to the survey, and “healthy,” with each obtaining 47 percent of the vote, respectively, from survey-takers. “Healthy” was last year’s No. 2 attribute with 60 percent selecting it. In this year’s survey the attribute saw a decrease of 13 percentage points.
To round out the Top 5 were “organic” and “convenience” with 43 percent and 28 percent, respectively. “Energy boosting,” last year’s No. 4 product attribute, dropped to No. 7. Improving its position on the list was “low sugar.” The product attribute was No. 9 in the 2016 study when 26 percent of respondents listed it as a latest trend. This year’s study saw the attribute increase its position by 1 percentage point (27 percent), but this placed it in the No. 6 slot.
Completing the Top 10 were “low calorie” (25 percent), “high protein” (18 percent) and “probiotic/prebiotic” (18 percent). The only product attribute from last year’s Top 10 list that dropped out was “vitamin, mineral fortified.” Last year, the attribute was No. 8, but it fell to No. 12 in this year’s survey.
Pick of the patch
Beverage-makers have always had a plethora of flavor options from which to choose when developing new products; however, as consumer tastes have evolved to include more exotic selections, we are seeing that old favorites still remain perennial choices.
When asked whether berry flavors are used in their beverage development, two-thirds of respondents noted its presence within their company. This is down from the three-quarters who indicated berry flavor usage in last year’s survey.
Among the survey-takers who stated they use berry flavors, the mean usage of flavors used by each responding company was 3.67, down from last year’s 3.82 mean.
The top berry flavor noted by respondents was strawberry, with 67 percent naming the berry fruit. It was followed by blackberry and raspberry, which tied for No. 2 as each received 64 percent, respectively. For strawberry, this was a 12 percentage point increase from last year’s survey in which it was noted by 55 percent of respondents. Although raspberry tied for No. 2 both last year and this year, its performance this year was a 9 percentage point increase. Blackberry made even better strides with a 14 percentage point increase compared with last year’s survey.
Other top berry flavors indicated by survey-takers this year were berry (54 percent), blueberry (44 percent), cranberry (41 percent) and acai (31 percent).
In comparison to last year’s survey, berry increased its percentage points by 13, allowing it to climb to the No. 4 spot. However, blueberry saw the greatest fall among survey-takers. Last year, 66 percent of respondents listed the flavor as an option used, but with only 44 percent naming it this year, it fell 22 percentage points to No. 5. Cranberry and acai also experienced decreases compared with last year’s survey, as they were down 9 percentage points and 14 percentage points, respectively.
This year’s survey also showcased respondents’ fondness for non-fruit flavors, as 83 percent indicated using these flavor options in their formulations. Among those who utilized non-fruit flavors, a mean of 3.98 flavors were used by each respondent company. In comparison to the previous survey, 81 percent of respondents indicated using non-fruit flavors, while the mean flavor used by each respondent company was 4.24.
The top non-fruit flavor selected by respondents was vanilla, with 66 percent indicating it as such. The Top 3 rounded out with chocolate (50 percent) and coffee (48 percent). This order mirrors last year’s survey with variations among the percent who selected the flavors. For instance, vanilla’s usage increased 7 percentage points compared with last year when 59 percent of respondents named it. Chocolate’s percentage usage remained unchanged as it also received 50 percent last year; however, coffee saw a slight decrease as its usage was down 2 percentage points from last year’s 50 percent.
Other non-fruit flavors that respondents noted as used in 2017 were green tea (38 percent), black tea (34 percent), cinnamon (32 percent) and root beer (30 percent). In comparison to last year’s survey, root beer was the only non-fruit flavor to show a percentage point increase. With a 10 percentage point bump from last year, root beer was able to move up from No. 11 to No. 7 in this year’s survey. Although respondents were not asked what beverage categories these flavors were utilized in, the growth of the hard soda segment might have been a contributing factor to the year-to-year improvement.
Fruit flavors also remain a popular option within beverage development. In this year’s survey, 82 percent of respondents stated that the companies they represent used fruit flavors in 2017 — only 2 percentage points lower than what respondents stated in last year’s survey. Among the survey-takers who indicated using fruit flavors in 2017, the mean number of flavors used by each respondent company was 7.98, which is down from last year’s 8.19.
When selecting which fruit flavors were used in 2017, domestic fruit flavors were indicated among the Top 5, but with one exception. The top fruit flavors named by respondents were lime (51 percent) and peach (49 percent), while apple, coconut and orange had a three-way tie with each obtaining 47 percent, respectively.
This Top 5 differs from last year’s survey, in which the exotic fruit flavors of mango and coconut were accounted for in the 2016 list. Mango led the list with 52 percent, while coconut and peach each had 50 percent, respectively. The remaining two of the Top 5 were lemon (48 percent) and apple (44 percent).
Lime’s ascension to the No. 1 spot in this year’s survey is thanks to an 11 percentage point increase, elevating the citrus fruit flavor from the No. 8 slot that it occupied last year. Lime was not the only citrus flavor that fared better in this year’s survey. Orange and grapefruit saw their percentage points and positions ascend in this year’s survey. Orange realized a 12 percentage point increase, while grapefruit moved up from its No. 10 position in last year’s survey to No. 4 with a 14 percentage point bump.
Also seeing its fortunes improve in 2017 was ginger. Although it only moved up to the No. 6 positioning from No. 8, ginger had 41 percent of survey-takers list it as a flavor used in 2017; this is a 6 percentage point increase from 2016.
For the year, vanilla emerged as the top-selling flavor with 23 percent of survey-takers listing the non-fruit fruit flavor. It topped the other non-fruit flavors that respondents named as top-sellers, which were chocolate (17 percent), coffee (15 percent), black tea (9 percent), and a three-way tie among green tea, root beer and tea (other) with 8 percent, respectively.
Among fruit flavors, apple was listed as the top-selling flavor in 2017. Twenty-one percent of respondents listed the fruit flavor, followed by ginger, grapefruit and lime registering a three-way tie at 17 percent, respectively, in this category. Orange also fared well as a top-selling fruit flavor with 15 percent naming it as such. Behind the citrus flavor was a four-way tie among coconut, lemon, mango and peach with 13 percent, respectively.
Within berry flavors, the top-selling flavor used in 2017 was a three-way tie among blueberry, raspberry and strawberry with 13 percent, respectively. The list rounded out with blackberry (11 percent), berry (8 percent), cranberry (8 percent) and acai (6 percent).
When looking toward 2018, respondents have high expectations for various flavors. Grapefruit is the most anticipated best-selling flavor for 2018, with 25 percent of survey-takers naming the fruit flavor. Other fruit flavors also are expected to do well in the new year. Twenty percent of respondents listed apple as an anticipated top-selling flavor, followed by a three-way tie among coconut, ginger and orange with 18 percent, respectively.
Among non-fruit flavors, vanilla received the most recognition from respondents, as 22 percent named the orchid-derived flavor as an anticipated top-selling flavor for 2018. Other non-fruit flavors that were named by survey-takers were chocolate (13 percent), coffee (13 percent) and black tea (10 percent).
Respondents also have high hopes within berry flavors. Leading the group, blackberry was named by 18 percent of survey-takers as an anticipated top-selling flavor for 2018, followed by cranberry (12 percent), blueberry (10 percent), raspberry (10 percent), acai (8 percent), berry (8 percent) and strawberry (7 percent).


