When it comes to the latest trends, “healthy” and “natural” continue to top the list of consumer needs and interests for beverages, according to respondents of
| Jump to: |
Beverage Industry’s annual New Product Development Survey. Thirty-three percent of survey-takers reported that “healthy” is one of the latest trends, while 30 percent thought the same of “natural.” “Natural” also continues to be important in flavors and colors, with three-quarters of respondents incorporating natural flavors in their products and more than two-thirds using natural colors.
Companies also will continue to churn out new products, as 58 percent of survey-takers indicated plans to launch more new products in 2014 compared with 2013. However, this is a decrease from last year’s survey in which 64 percent of respondents said they planned to launch more new products in the marketplace versus the prior year.
Across the areas of new product development, 42 percent of respondents said they will develop beverages in the coffee and tea categories. Sports and energy drinks also garnered 42 percent, with water and juice trailing closley behind with 41 percent of survey-takers planning to develop beverages in these categories. Of the remaining categories, 35 percent named dairy-based drinks and alternatives; 28 percent said wine, beer and spirits; and 20 percent named carbonated soft drinks as their areas for new beverage development.
Go with what you know
Following suit with the last few years, respondents continued to opt for more traditional flavors for their new product development in 2013. However, unlike previous years, the top-used flavor in 2013 was not occupied by a fruit. Instead, vanilla emerged as No. 1 with 48 percent of survey-takers reporting using the flavor in 2013. Not far behind vanilla was lemon with 46 percent of survey-takers reporting using this citrus flavor. Also rounding out the Top 10 were strawberry, mango, peach, orange, raspberry, chocolate, apple and fruit punch flavors. Peach saw a 2 percent rise in use from 2012, while chocolate use increased 7 percent, and fruit punch jumped 11 percent in use. Click here to see other flavor trends from the survey.
Among those that fell out of the Top 10 were berry, which dropped from 51 percent to 30 percent in use to land at No. 12 overall. Cherry also saw double-digit decreases, going from 47 percent usage in 2012 to 29 percent in 2013. The biggest fall, however, was blueberry, which fell from No. 1 to No. 29. Reported use of the fruit flavor decreased 32 percent compared with last year’s survey.
The survey also saw some new “faces” on its list of the Top 30 flavors used in 2013. Cinnamon emerged with 28 percent indicating using the spice flavor. The list also added ginger, mint and hibiscus.
Similar to its rise in use, strawberry gained in the top-selling flavors of 2013. A quarter of respondents listed the fruit flavor among their top-selling flavors, helping it maintain its No. 1 status for the second year in a row.
Up 1 percent from last year, chocolate moved up to the No. 2 position of top-selling flavors, with 14 percent of survey-takers naming the indulgent flavor. Joining the Top 10 best-selling flavors was lemon with 13 percent of respondents listing the citrus flavor among their top sellers. Also new to the list for 2013 were fruit punch, lime and mango, each with 10 percent of survey-takers naming them among their top-selling flavors.
Reflecting similar success to its 2013 flavor sales, strawberry was named the anticipated top-selling flavor for 2014, with 20 percent of respondents listing it. Not far behind are lemon and vanilla at 19 percent each. This is a slight deviation from last year’s anticipated top-selling flavors, which had vanilla in No. 1 with 19 percent of the vote and strawberry as No. 2 with 18 percent of the vote. Lemon, however, jumped up 9 percentage points compared with last year to crack the Top 3 for anticipated top-selling flavors.
One of the biggest increases came from cinnamon. Thirteen percent of respondents named the spice flavor as an anticipated top seller for 2014 compared with 3 percent last year. Other big gainers outside of the Top 10 include green tea (up 6 percentage points from last year), blackberry (up 8 percentage points),
mint (up 5 percentage points), banana (up 7 percentage points), and root beer (up 6 percentage points).
But one area that still fared well was the use of natural flavors. According to the survey, about three-quarters of respondents will use natural flavors in 2014. Among those expecting to use natural flavors, three-fifths said this is an increase in their use of natural flavors from 2013. When indicating the reasons for the increase, consumer demand/preference was named by a majority of survey-takers.
Similar results also were shown when it came to color usage for 2014. An average of more than two-thirds indicated that they will use natural colors. Among those respondents from this year’s survey, more than half said their natural color usage has increased, with the majority labeling customer driven/requested as the reason for the increase.
Know your attributes
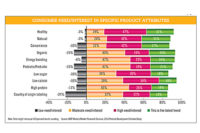
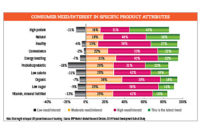
When developing new products, beverage producers need to consider a number of attributes in order to appeal to consumers. According to survey-takers, “healthy,” “natural” and “organic” are the Top 3 attributes that consumers need or have an interest in.
For the “healthy” attribute, 16 percent listed a moderate need/interest, 46 per-cent indicated it was of high interest/need, and 33 percent said this was the latest trend. Only 4 percent dubbed this as being of low need/interest. Similarly, “natural” garnered 16 percent of responses as being of moderate interest/need. However, no respondents indicated this as being of low need/interest. Fifty-four percent said it was a high-interest attribute, and 30 percent dubbed it the latest trend.
The right fit
In order to develop products that meet those consumer interests and needs, companies depend on a strong team throughout the development process.
According to respondents, the average number of employees developing new products is 60, with a median of eight people. This marks increases from last year’s survey in which the average number of employees developing new products was 21 employees for the mean and five employees for the median.
Although survey-takers indicated that a number of employees are working on new product development, that doesn’t exclude outsourcing from the process. Slightly more than one-third of respondents said that they outsource a portion of their development process. This is up from the 2012 survey in which slightly less than one-third said that they outsource a portion within the process.
Nearly all respondents (93 percent) indicated using a team approach for their development process. Among the departments involved, R&D and sales and marketing were regularly involved. The next highest among the departments is upper management. More than three-quarters of survey-takers whose upper management is regularly included in the new product development process included the chief executive officer in the team.
Roughly three-fifths of respondents said that supplier involvement is part of their new product development process. This is analogous to last year’s results in which 62 percent noted supplier involvement.
When determining the timeframe to develop a new product, the average number of months it took respondents to develop a product from inception to launch was nine months. A quarter of survey-takers said this was faster than previous years. In comparison, respondents from the 2012 survey said the mean time from inception to launch was 10 months, with 25 percent also indicating this was faster than previous years.
According to respondents, the average number of new products developed by a company in 2013 was 40; however, the average number released was 17, which is about 43 percent of the number developed. The average number of successful products was 11, which equates to 28 percent of those developed and 65 percent of those released.
Planning for the future
As we enter the 2014 calendar year, more than half of survey-takers plan to launch more new products into the marketplace compared with 2013. Slightly more than one-third are planning the same amount. Among those that plan to increase their new product launches, the average increase is expected to be 34 percent.
Regarding plan and post-launch assessment, more than three-fifths of survey-takers indicated they have a definitive plan and/or assessment in place. Fifty-two percent said they have both planning and assessment in place, while a quarter said they have neither.
Regarding budgets, 52 percent of respondents said they expect their 2014 R&D budgets to remain the same as in 2013, while 41 percent expect an increase. BI
Beverage Industry’s New Product Development survey was conducted by BNP Media’s Market Research Division. The online survey was conducted between Sept. 23 and Oct. 11, 2013, and included a asystematic random sample of the domestic circulation of Beverage Industry and its sister publications Dairy Foods and Prepared Foods.
Of the respondents, 43 percent process coffee and tea, 43 percent process juice and juice drinks, 38 percent process energy drinks, 32 percent process dairy-based drinks, 28 percent process sports drinks, 25 percent process water, 23 percent process carbonated soft drinks, 16 percent process spirits, 16 percent process wine, and 14 percent process beer.
Thirty-five percent of respondents were from companies with less than $10 million in annual revenue. A total of 19 percent were from companies with an annual revenue range of $10 million to $50 million. Ten percent of survey-takers were from companies in the mid-size range — $50 million to less than $100 million. Reporting $100 million to less than $500 million in revenue were a total of 16 percent of respondents. Seven percent were from companies with revenue from $500 million to less than $1 billion. Thirteen percent of survey-takers were from companies reporting more than $1 billion in annual revenue.
Respondents were split 58 to 42 percent in favor of males with an average age of 41. Fourteen percent indicated one to three years of industry experience; 29 percent said they have four to 10 years of experience; the majority, 32 percent, registered with 11-20 years of experience; 16 percent indicated having 21-30 years of experience; and 9 percent had between 31 and 40 years of experience.


