![]()
Private Label Beverages:
The gateway to retailer loyalty
by Joana Cosgrove
Often overlooked in favor
of more widely recognized national brands, private label (PL) beverages,
occupy an understated space on the shelf.
While it’s true PL beverages lack the marketing
dollars that buoy national brands, and are inherently more susceptible to
market fluctuations, they quietly play the
important role of “gateway product” when it comes to drawing
consumers into a retailer’s realm of PL products.
This characterization is especially true when it comes
to PL carbonated soft drinks, the single largest supermarket grocery
category, chalking up 5 to 6 percent of typical grocery sales. “Soft
drink penetration is well over 90 percent to 95 percent with a high
frequency and velocity,” says Edmund O’Keefe, vice president of
investor relations and corporate development, Cott Corp., Toronto, Ontario.
“We’ve found that if a customer
likes the retailer brand proposition associated with the soft drink then
they’re more likely to try, for example, the salsa, cookies or
detergent – a phenomenon that we call the “halo effect”.
If you get it right, you’re not only helping improve your position,
point of difference and profitability in CSDs, you’re also building
the halo effect for your retailer brand program all across the
store.”
The halo effect initiated by PL soft drinks is crucial
considering the ongoing trend of retail consolidation in which large
retailers continue to get larger. “As they consolidate, the market
and become more powerful, they will turn to PL as a key driver for
differentiation because each retailer wants to position themselves somewhat
differently,” comments O’Keefe, who adds that the biggest
market opportunity for PL is the U.S. market. “On a volume basis in
carbonated soft drinks, PL has 27 percent of the market in England, it has
20 percent of the take-home market in Canada, but it’s only 11
percent in the United States. Clearly the United States is a significant
market for retailer brand soft drinks. The best-in-class large retailers in
the United States have PL shares of between 20 percent and 35 percent of
their soft drink volume, whereas the average is only 11 percent. As the big
retailers get bigger and concentrate the market, they’re driving
those shares up.”
During the past five years, sales of carbonated soft
drinks – both PL and national brands – have fallen sharply, due
in large part, to increased water consumption, which is the byproduct of an
increasingly health-focused and obesity-wary consumer population. Instead
of reaching for a cola, more consumers are guzzling calorie-, caffeine- and
carb-free sparkling flavored waters. “The water category is a $700
million category, and PL accounts for about 22 percent of it. It has grown
about 10 percent this year, and in units it has grown about 25 percent to
30 percent,” says Tom Aquilina, Aquilina & Associates, a
Chicago-based consultant who teaches Private Label Sales and Marketing
Strategies course curriculum at St. Joseph’s University.
“If you look at a supermarket today, space
allocation for water at retail is probably 30 percent to 40 percent greater
than it was five years ago. What used to be a beverage aisle is now largely
dedicated to waters of all types – distilled, spring – and the
consumption is huge because the water industry has done a tremendous job
marketing water.”
The sparkling flavored water category is a shining
example of how PL is capable of creating its own distinct and successful
niche. It also illustrates PL’s ability to be both a follower and, in
this case, a leader in flavor creation. “Speed to market with new
flavors is an area of strength for PL,” Cott’s O’Keefe
says. “A lot of new flavors like pineapple and strawberry are favored
by the Hispanic market and the average consumer alike, and PL can respond
quickly with innovative flavors.”
PL juices
Much like PL carbonated soft drinks, PL chilled juices have hit hard times thanks to what industry
insiders call “The Cola Wars: Part 2.” Pepsi-owned Tropicana
against Coca-Cola-owned Minute Maid have commoditized the juice business by
enacting the same battle plan the two companies used to grow their soft
drink business, to the detriment of PL brands.
“Twenty years ago, Pepsi and Coke took prices
down to a point where PL didn’t make any sense. If you could buy a
2-liter bottle of Coke or Pepsi for 89 cents, why would you buy a bottle of
PL cola for 79 cents? That’s what happened with juice,” says
Rich McCelland, director of marketing, Pasco Beverage Co., Dade City, Fla.
“You can find two (64 ounce) cartons of Tropicana or Minute Maid on
sale for $4 almost every day, so you have a situation where the average
consumer wouldn’t buy a PL juice at $1.99 because they can get a
national brand for only pennies more. Unless they are familiar with or
already enjoy the taste of a PL brand, the consumer will almost always opt
for the national brand.
“Minute Maid and Tropicana aren’t making
money selling juice at two for $4,” he continues, “but the
companies behind them are so big, they can afford not to –
that’s not the case for most PL suppliers who can’t afford to
lose money.”
Putting PL juices back on track is a slow and
educational process. McClelland says he tries to help category managers
understand that this kind of national brand pricing is erosive and
self-defeating. “Tropicana and Minute Maid are available
everywhere,” he says. “When retailers sell Tropicana at two for
$4, it reduces margins, supplies temporary consumer gratification and maybe
even refrigerator load. But apply that same scenario to PL and the juice
becomes a destination product because you can’t buy Sam’s
Choice orange juice any place other than a Wal-Mart.
“When a consumer gets hooked on the fact that
Giant’s PL has the quality of a national brand with a price-value
relationship that’s significant, than Giant becomes a destination for
the consumer,” McClelland explains. A major PL hindrance is that most
consumers don’t realize retailers have rigid control standards and
criteria for selecting private label vendors that’s equal to or
better than the national brands in quality, he adds.
Sales of some single-fruit PL juices like orange are
definitely suffering, but sales of allied juices are growing. Pasco is
currently producing a line of mango, guava and strawberry-banana nectars
for PL accounts like HEB that are a hit with consumers of all ethnicities.
Juice blends like apple-cherry and cranberry-grape are also popular. In
single-flavor juices, grape juice is getting a lift from studies linking
grape and grape juice consumption to a variety of health benefits.
McClelland believes the surging popularity of juice
blends is attributable to the same trend that’s impacting beverages
across all categories: the quest to provide flavorful and healthful alternatives to soft drinks.
Courting the PL consumer
The groundwork for increasing PL beverage shares has
been laid, but in the meantime there’s a lot of work to do, according
to Aquilina. He says first retailers must find a way to win customers using
flavor. “A Coke consumer probably does not drink Pepsi, and
vice-versa. They’re loyal and they’ve acquired the certain
taste that each brand delivers,” he says. “PL has not provided
that point of differentiation in taste to create that sort of
following.”
His second assertion for increasing the share of PL beverages
boils down to on-shelf merchandising. “There’s a tremendous opportunity
to market carbonated beverages in supermarkets, but retailers have to realign
their current merchandising strategy compared to where it is today, it can’t
be an afterthought. DSD is very territorial with their shelf space and they
manage it extremely well.”
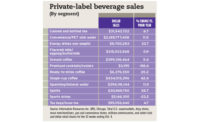
| Private label product sales | ||||
| Dollar Sales | % Change vs. Year Ago |
Unit Sales | % Change vs. Year Ago |
|
| SPIRITS | $130,117,256 | -5.3% | 14,931,141 | -7.5% |
| CONVENIENCE/PET STILL WATER | $269,861,984 | 27.0% | 130,810,344 | 12.9% |
| JUG/BULK STILL WATER | $324,489,312 | -3.4% | 361,754,816 | -6.4% |
| SPARKLING/MINERAL WATER | $86,170,408 | 21.1% | 123,367,040 | 22.8% |
| COFFEE ADDITIVE/FLAVORING | $466,260 | -18.0% | 156,797 | -23.3% |
| GROUND COFFEE | $112,899,816 | -3.1% | 43,988,524 | -3.5% |
| GROUND DECAFFEINATED COFFEE | $33,000,692 | 0.9% | 11,743,059 | -0.8% |
| INSTANT COFFEE | $29,767,058 | -3.4% | 10,380,507 | -1.5% |
| INSTANT DECAFFEINATED COFFEE | $10,036,108 | 3.9% | 2,886,060 | 4.6% |
| WHOLE COFFEE BEANS | $26,553,128 | 0.4% | 5,842,718 | 1.3% |
| REFRIGERATED TEAS | $16,240,978 | 1.9% | 11,626,932 | -3.0% |
| CANNED AND BOTTLED TEA | $21,869,780 | 28.1% | 13,524,116 | 21.4% |
| BEER | $11,053,980 | -7.5% | 685,092 | -9.4 |
| Source: Information Resources Inc., Total U.S. Food, Drug and Mass Merchandise (excluding Wal-Mart) for the 52 weeks ending Aug. 8, 2004. | ||||


